UFTI Service Observation Reductions
(Document number VDF-TRE-IOA-00008-0001)
Jim Lewis
Introduction
Over the past several years we have been trying to make sense of the best way
to reduce data from WFCAM. As NIR data differs from optical data in
various ways, it is not always possible to apply tried and tested methods from
the optical to the infrared. All cameras are different, so the only way that
we'll be able to determine the optimal way to deal with WFCAM data is to wait
until some WFCAM data becomes available. While we can begin this process
for WFCAM with laboratory test data, final tuning will require on-sky
characterisation. Meanwhile we can use data from other
infrared cameras to test various options. Data from UKIRT's imager UFTI is
the subject of this report.
Data reduction of UFTI data has been going on for some time and there are
standard recipes in place that cover the various observing modes and object
types. Over the past few years, in designing and implementing a data
processing pipeline for WFCAM, we have noticed several aspects of UFTI
data reduction that we
have found a little unsatisfactory (we have spoken about this at length in
the past). As a reminder, some of the worrying issues are:
- Dark correction
- Currently this is done by taking a single dark frame before a
given set of exposures. This is subtracted off of each target frame
as the first major reduction step. Ideally the mean 2d dark
current signature should be derived from many frames that have been
averaged. This allows cosmic rays and other defects to be
rejected and hence not propogated through the target data and also
the reduces the additional dark frame rms pixel noise. It
is also the case that a dark frame on UFTI is not so much a measure
of dark current, but also an estimate of the reset anomaly. All IR
detectors seem to display this to some degree and it has been seen
in most of them to vary with exposure time (this is very obvious
in ISAAC data for example).
- Flat fielding
- Flat fielding can be done in a number of ways, none of which are
currently 100% satisfactory. The most popular options are:
- Twilight sky flats: These are good in that the flux levels
are high enough to ensure good statistics and illumination
levels should be pretty uniform. The high flux levels are
also useful in making sure that effects due to fringing and
dust do not dominate the background. The colour match to the
night sky is not ideal, but is fairly close. Time to observe
these is limited and it may not be possible to observe flats
in all the filter passbands on a single night. (This is not
an issue if the flats are stable over longer time periods.)
- Dome Flats: The flux levels can be adjusted to whatever you
wish. There are problems with uniform illumination and the
background sky colour match is bad. They can be observed
during the day, so acquiring them is simple and, if
nothing else, they can be used for deriving and monitoring
bad pixels.
- Night sky flats: The main benefit of these is that they are
derived from night sky observations and hence the colour
match to the target frames is very good. Illumination is
uniform too. The count rates are relatively low however and
hence the sky signature is dominated by fringing and thermal
dust emission. With UFTI the fringing can be as much as 6%
(peak to trough), which could result in a similar sized
systematic error in photometry.
From these considerations, it is reasonably clear that twilight sky
flats give the best chance for an accurate representation of the 2d
gain profile of the detector.
- Background variations
- With the term 'background' here we are coalescing several additive
effect like thermal dust emission, 2d sky background and fringing
(and residual reset anomaly if present). All of
these can vary and not necessarily sychronously.
In what follows I describe some of the reasons that UFTI data are reduced as
they are and how this contrasts with how we think WFCAM data should be
processed.
Twilight Flat Problems
Apart from problems of actually obtaining twilight flat exposures (owing to
time pressures at the beginning and end of the night), the main reason that
these are not used for UFTI seems to be a form of image
persistence which appears on the UFTI detector after exposure to a high flux
background. Below is an example of what happens to a dark frame after several
exposures of a bright twilight.
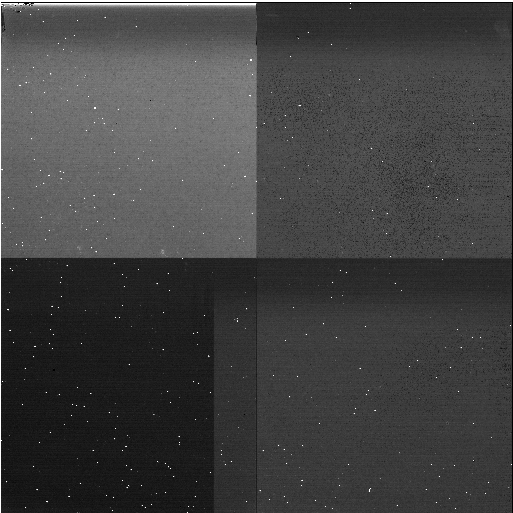
f20030923_00312
The lower lefthand quadrant shows the most worrying trend. These features
do decay with time though and return to near normal within 10 to 20 minutes.
The actual twilight flat field exposures begin to show unusual features once
the count rate gets above about 1200 counts per second. Below is an example
of a flat field exposure with a count rate of about 1600 counts per second.
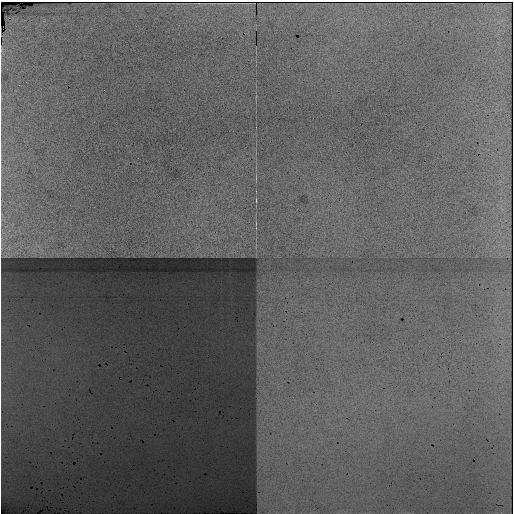
f20030923_00311
(NB: The root cause of these effects is not completely clear, but since
they are present, they have to be worked around.)
The effects you see in these two exposures have lead us to the belief in the
past that doing twilight flats with UFTI is not feasible. On the one hand, if
a bright sky is going to affect the detector with some form of persistence that
lasts into the night, then at best we would waste up to 30 minutes or so just
waiting for the chip to stabilise and this is something that most observers
would not be willing to put up with. There is also the issue of what the
actual twilight exposures would look like. If taken during sunset, the
brightest sky exposures will resemble the above and subsequent exposures
(although taken with a low enough count rate) will be affected by the above
mentioned persistence, rendering them useless.
The key to resolving this issue is to realise that using twilight exposures
taken during sunrise will only show the above features at the end
of the run of exposures. Hence any image with a low enough count rate should
be useable as these features only show up once the flux reaches a certain
threshold. Below is an example of a sunrise twilight flat taken with a
count rate of about 850 counts per second.
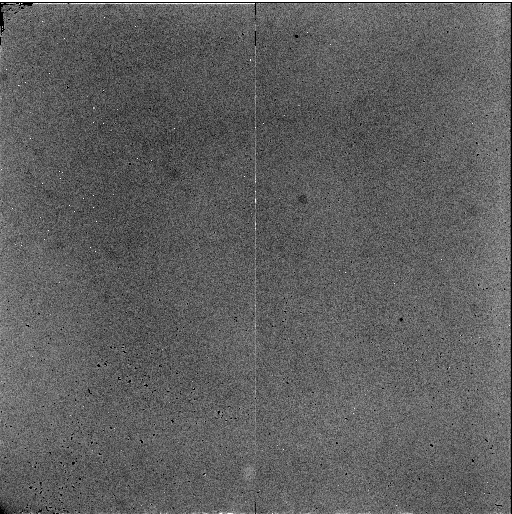
f20030923_00295
This shows the well illuminated good signal-to-noise flat field that one would
like to have. This is a exposure in H, which is a band that has a high
amount of fringing. It is worth noting that there is no sign of fringing here,
which shows that the background level is high enough to dominate the scene.
Although thermal emission from dust in H is not expected you can actually see
where the dust has settled on the cryostat window as some of the dark spots.
Given a series of flat exposures like this, it would be possible to use
twilight flats with UFTI. This then gives us hope of flat fielding data from
WFCAM in a similar way (ie. derived external to the observing blocks). The
only real difference is the projected sky area on the pixels for WFCAM, which
gives a smaller window of opportunity before saturation effects kick in.
Dark Correction Problems
As mentioned before, the standard procedure with UFTI is to take a single dark
exposure before observing the current exposure sequence. This dark exposure is
taken with the same exposure time as the target images and hence both the
dark current and reset anomaly for the target frames should be well modelled
by it (other caveats notwithstanding).
Using a single dark frame to do this correction means that transient defects
in the dark frame propogate into the target frames. Whereas a mean
dark frame that has been formed from many individual exposures (with
appropriate exposure times) can have such
things filtered out and the rms noise reduced. If a set of exposures
must have its own mean
dark frame, as seems to be the case, then to do a series of dark exposures for
each target exposure series would cause a serious drop in observing
efficiency.
It is often the case in the infrared that it is highly desirable to subtract a
2d sky estimate. This helps to remove fringing and thermal background
variations and seems pretty much essential for UFTI. Given that and the
existence of an independent mean flat field (i.e. a flat not formed from
a combination of the current target frames),
a better option might be not to do a separate dark correction step on the
target frames at all.
Since the sky background, the reset anomaly and the dark current
are all additive terms they can all be subtracted together after the target
frames have been flat fielded. Doing a combination of the post flat-fielded
target frames (with suitable rejection so that stars and transients are
removed) will lead to a frame that is a combination of the mean sky, reset
anomaly and dark current. This one frame can be subtracted from the from
each of the target frames in turn to remove all three effects.
Extra Background Variation Removal
In the previous section I mentioned that using a combination of all post
flat-fielded target exposures would model out not only the dark current and
the reset anomaly, but also the sky background. The latter is not strictly
true when it comes to removing contributions from things like
thermal dust emission and fringing.
Thermal dust emission in UFTI comes from radiation emitted by dust on
the cryostat window and is only visible in the K band. The flux depends on
temperature and thus if the latter is stable, so is the former. This means
that although the mean sky background level may vary, so long as the
dust temperature is reasonably stable, then the amount of thermal emission
won't vary much.
Fringing in UFTI appears to be visible in all three of the main broad band
filters, but especially in J and H. Below are sky exposures in J and H
(the latter has been flat fielded)
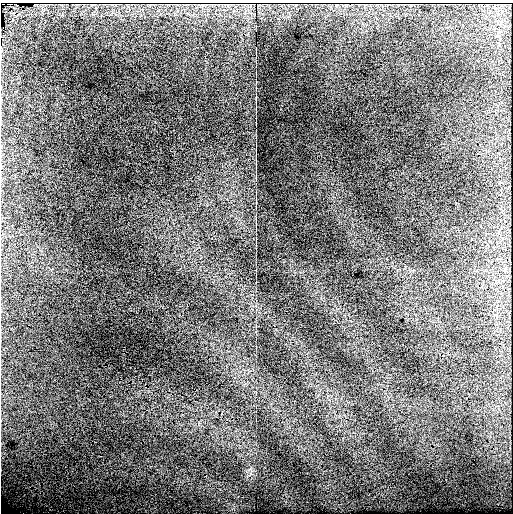
f20020428_00103 to 00111
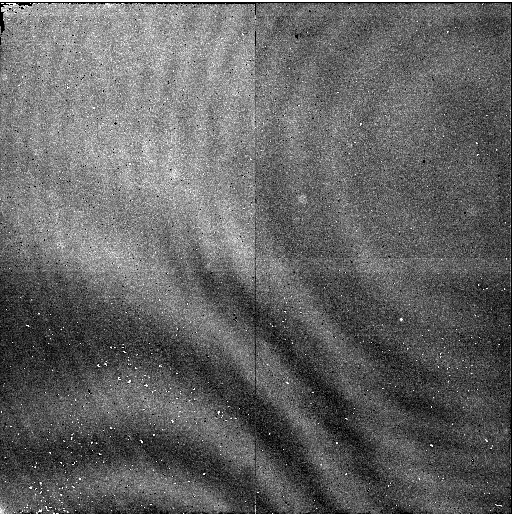
f20030923_00006 to 00050
Each of these exposures clearly shows two sets of fringes. The exact origin
of these is not at issue here. We need to accept that (1) they exist and (2)
are not part of the flat field (which the flat field exposures earlier on
in this report clearly show).
Below is image of the sky in K. The fringes that look like concentric rings in
the previous two wavebands are still present here, although the centre seems
to have shifted somewhat. All of the fuzzy dots you see are caused by thermal
emission from dust.
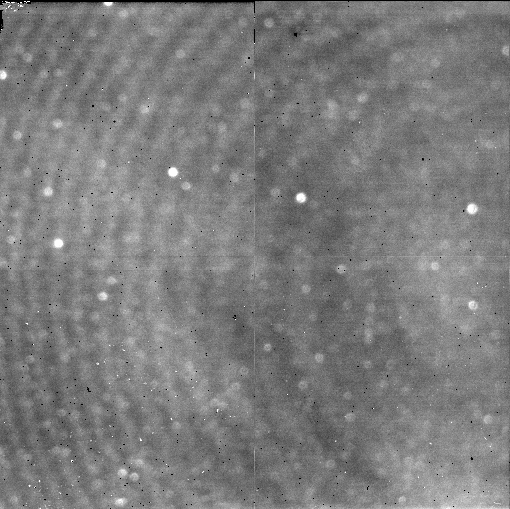
f20031008_00153 to 00201
The problem with fringes is that they can vary
over the night and within one exposure series in the same way that the mean
background does, but not necessarily sychronously with it. If the fringing
varies over timescales shorter than that of a single exposure sequence (that
is the timescale of the exposures used to form the mean sky frame) then
it will be necessary to put in an extra defringing step to correct for this.
In what follows, I have just done a simple subtraction of a single mean sky
frame for each exposure series. The fringing is removed to a very high degree,
but in some frames a residual is visible. I'll assess the level of this
residual later on.
Observations and Adopted Reduction Procedure
Two nights of UFTI observations done on 20030923 and 20031008 are used in
these
examples. They were taken in service time to be used by the groups working
on WFCAM data processing to help decide the best way to reduce WFCAM data.
Only H and K
observations were done during these nights, and as such I'm reducing the scope
of this analysis to those two wavebands only. The observations consist mainly
of long (35-40) minutes exposure sets, each exposure being between 10 and 40
seconds long.
The reduction procedure employed and outlined below represents what I feel will
get the best result from these data sets. This is not to say that this is the
definitive way to reduce data from WFCAM.
- Form a mean flat field. Choose sunrise twilight flat field exposures
where the
count rate is high enough to dominate the fringing and thermal emission,
and low enough not to show the persistence problems demonstrated above.
In the case of both of these nights, a single dark frame was taken
before the twilight exposure series and this was used to dark correct
the twilight flats. The ideal would be to take a series of darks just
before sunrise to fulfill this purpose (a series of darks taken after
sunrise would obviously not be useful). Combine the dark-corrected
twilight flat field frames into a mean frame using a suitable rejection
algorithm to remove transient remnants. Normalise this frame to a
mean of 1.0. Create an initial confidence map from the flats.
- Divide each target frame in an exposure series by the flat field. Then
combine all the target frames in the series to form a mean sky image
(again with suitable rejection to remove transients and astronomical
objects). Normalise this average sky frame to an mean value of zero.
- Subtract the mean sky frame from each of the flat fielded images in
the exposure series. Having normalised the mean sky frame to zero
ensures that the DC sky level is retained in each object image.
- Assign a rough WCS to each target frame based in header information.
Use this information and the positions of objects on the frames to work
out the cartesian offsets between images.
- Combine the object frames using the derived offsets into a single
stacked image. Do weighting using the confidence map.
- Generate a catalogue of objects on the stacked image. Use this
catalogue to fit a WCS to the stacked image and hence assign equatorial
coordinates to each object. (Astrometric standards come from the
2MASS point source catalogue.) Objects in the catalogue are also
classified as stellar/non-stellar/noise.
- Work out a photometric zero point.
Results
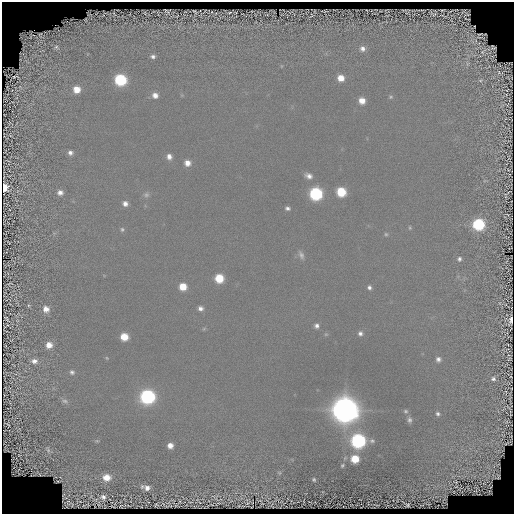
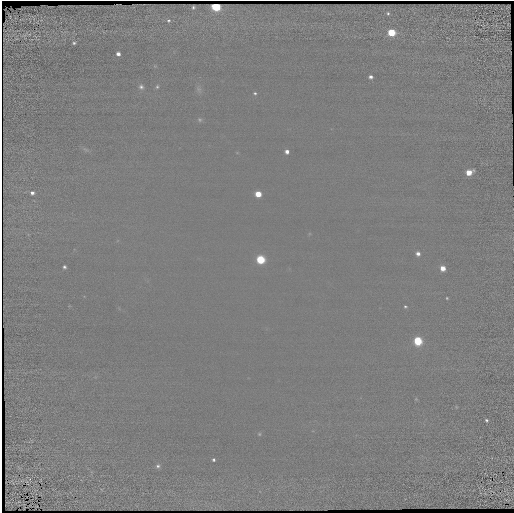
Below are some of the tiles that have resulted from these service nights.
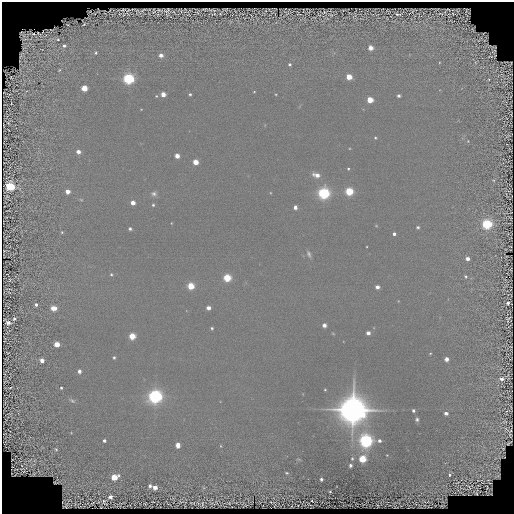
Tile 5 from 20030923 (H)
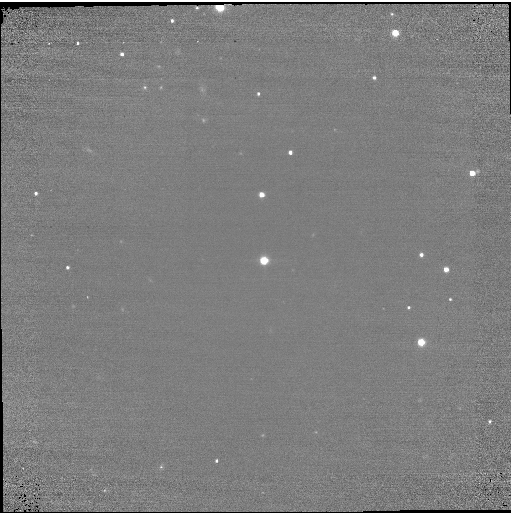
Tile 60 from 20030923 (H)
Tile 98 from 20031008 (K)
Tile 144 from 20031008 (K)
Discussion of Results
Without an accurate transformation of 2MASS magnitudes onto the UFTI system,
it's impossible to work out a real photometric zero point from these
observations. Using the naive assumption that they are the same, then the
zero points from stars on both nights agree with 2MASS to a rms of 0.1
magnitudes. This is well within the limits constrained by the internal
consistency of the 2MASS magnitudes, especially at the faint end. The
astrometric accuracy works out at about between 90 and 100 milli-arcseconds.
Comparing a set of frames reduced this way with the same frames reduced with
night sky flats also shows that using twilight flats reduces the mean sky noise
in the individual frames by about 4-5%.
There appears to be a type of pickup noise which is just visible in tiles 60
and 144. The pickup appears on some frames at about the 0.5 to 1%
level, but not on others. When
it appears the pattern location appears to vary, so this is not an artifact of
the reduction process. If this sort of thing appears on WFCAM frames, then
perhaps a background subtraction algorithm where the mean background is formed
from a sliding median of surrounding frames would be the best way to remove it.
There is one other issue of further concern related to whether the processing
accurately removes the fringing that has been seen in all the frames.
The fringe removal was only done during the sky background subtraction phase
and if the fringe pattern varies a lot over the course of the series of
exposures, then there may will be positive or negative fringe residuals on the
individual frames. Looking at the images that combined to make tile 5 from
the night 20030923, we look at the difference in the median in two regions to
work out the amount of fringing on each frame before and after sky subtraction.
On this particular tile, the average fringing was 3.12% of the sky background.
The dispersion about this mean was 0.13%. After sky subtraction the average
difference was 0.01% with a dispersion of 0.14%. Below is one of the images in this
series with the largest amount of fringing. After it, is the same image
after sky subtraction. Certainly to the eye there is virtually no residual
fringing to be seen.
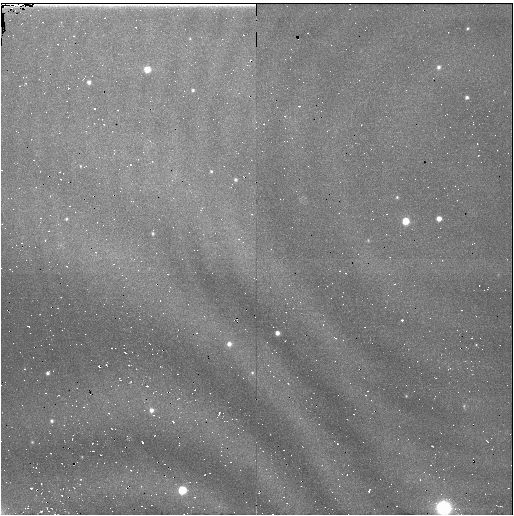
f20030923_00014 flat fielded
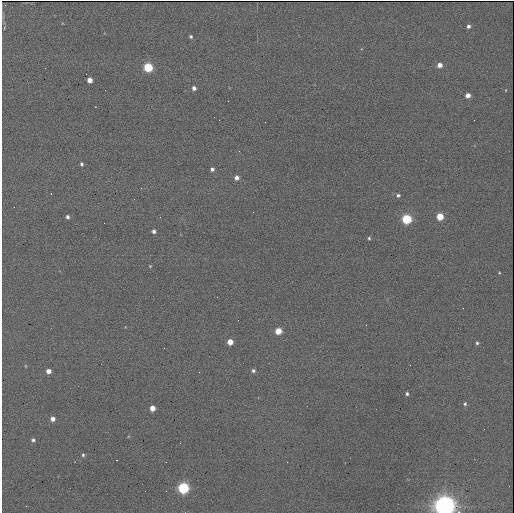
f20030923_00014 flat fielded and sky subtracted
Last modified: Mon Feb 16 16:52:01 2004


