Representative image subtraction algorithms that make use of adaptive kernel matching techniques have been wrapped within suitable driver software and tested on both narrow and broadband INT WFC data. These modules have also been compared with a general purpose, but simple, WCS-based CASU implementation of the same ideology. Some quantitative comparison measures have been developed and used to assess the performance. Although both tested external algorithms performed well in general, there were sufficient problems encountered with both, including: artefacts caused by ringing; peculiar output noise properties; inability to use and produce confidence maps; and difficulties with handling the edge boundary problem; together with a limited range of options, to warrant development of an in-house solution to the problem. This development borrowed heavily from prior experience with these packages and results from the first in-house version were included in Version 1.0 of this report. An updated and improved version of the in-house software has now been produced and forms the basis for Version 2.0 of this report.
With the incorporated improvements the CASU software is now sufficiently well developed to satisfy the majority of the VDFS V1 and V2 requirements, subject to minor enhancements resulting from more extensive testing of the software on a range of real data.
Image subtraction, or difference imaging, methods are used in several diverse branches of astronomy covering: transient event detection (eg. SNe, NEAs); variability monitoring in crowded stellar fields (eg. detection of transiting planets, stellar variability, microlensing); continuum subtraction for narrow-band imaging. The common problems for all these cases are: alignment of the different images; tracking and removing non-astronomical background changes; scaling the fluxes of objects to optimally match; and allowing for differences in effective seeing between the images.
The main advantange of difference imaging is that it greatly simplifies subsequent analysis and can lead, for example, to much more accurate differential photometry. The main disadvantage is that it is difficult to accurately match images taken in different conditions.
Adaptive kernel techniques (see Alard and Lupton 1998 ApJ 503 325 for more details) have gone a long way toward removing this limitation but their implementation and practical robust use is still an open question. Consequently we have made a series of tests of different image subtraction software packages designed to probe for commonalities and to enable implementation of a robust version of these techniques for routine survey volume use.
Version 2.0 of this document reports on the progress made so far and updates the analysis presented in the earlier version.
Four implementations were tested:
For the tests, the toads software was adapted to be driven from the existing WCS alignment driver code from simple/adaptive, enabling the algorithm used to be controlled via a command-line parameter. The iab code was not adapted in this manner, but it is planned to make this modification in the future if the code is needed for further use and testing.
For the initial tests, images from the INT wide field camera (WFC) were used. Simulated data frames have been used to aid in debugging the CASU algorithm development, and in some of the early tests. Results from the simulations are not reproduced here since real data with real PSFs and artefacts provides a much more stringent check of software integrity and performance. Future tests will involve analysis of a series of frames for generating differential time series photometry, since handling this type of programme is a requirement of V3 of the VDFS pipeline and is also an excellent test of the methodology.
A pair of data frames with similar seeing, and another pair with seeing differing by a factor of approximately 1.5, taken with the INT WFC, were subtracted using each implementation in turn, in each case using the run with better seeing as the reference and subtracting it from the other (though all the software deals automatically with the opposite case anyway). Where any parameters were provided by the software, these were left as the defaults, and the information from the image headers was used to inform the adaptive kernel code of the seeing.
The adaptive kernel subtraction was driven from the standard catalogue files for the INT WFC data in the cases of simple/adpative, toads and for iab the internal source detection code was used since this implementation had not been extracted into a form which could be called in the same manner as the others.
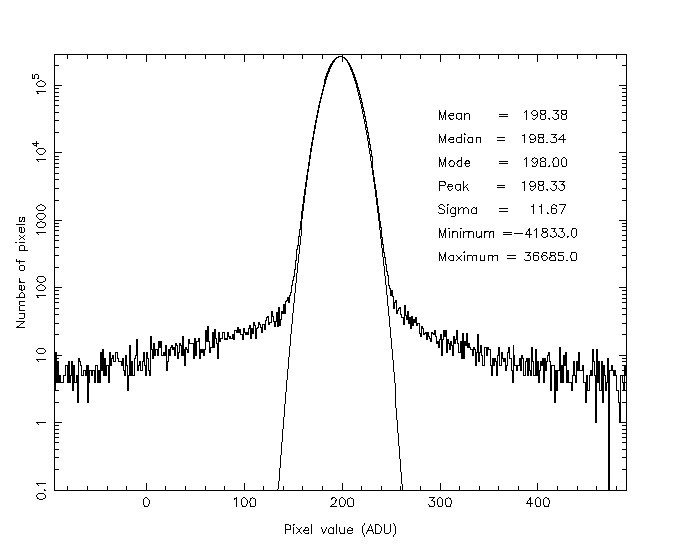
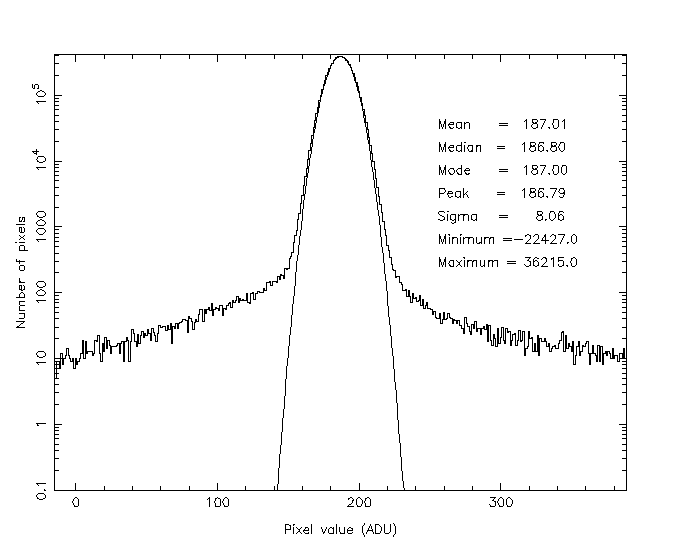
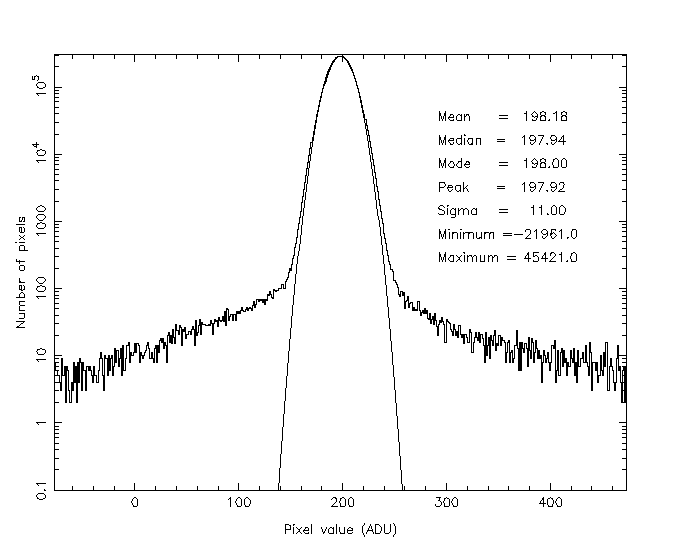
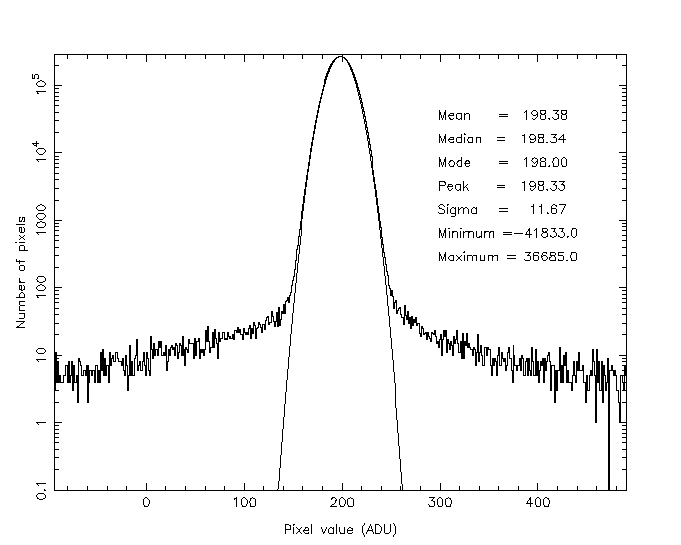
The subtracted images were used to plot a density histogram (the number of pixels with a count value in each bin versus the count value) of the output in each case, and some statistics calculated consisting of the mean, median and mode pixel value, the peak value, standard deviation of the peak, and maximum and minimum pixel values. These were included on the plots. For the tests, only one CCD of the WFC is shown. Each plot has an overlaid Gaussian using the derived value of sigma. Note that the assigned overall background level is somewhat arbitrary and for these cases was chosen to be equivalent to the input frame levels.
Further histograms of the cumulative fraction of pixels lying at n-sigma or more from the sky level (the combined sigma was extracted from the standard WFC catalogue files as the quadrature sum of the values from the reference and comparison images so as not to be influenced by the differencing process), were also made as a simple quantitative summary of the results.
When evaluating the results of the subtractions, a 4-pixel border at the edge of the images was ignored to prevent effects due to level differences at the edges affecting the results. These were responsible for a small subsidiary maximum in the density histograms for iab. Edge effects and other artefacts (eg. saturated pixels) are automatically catered for in the CASU implementation.
Links to the input and output FITS files are provided for examination of the images.
The images with similar seeing (runs 347861 and 347863) were subtracted and the results for CCD 1 are shown. The density histograms for simple, toads, iab and adaptive are included in Figures 1, 2, 3 and 4 respectively. The cumulative fraction histogram for the images is included in Figure 5, and sample sections of the input and difference maps are shown in Figure 6.
 |
| Figure 1: Density histogram for simple. |
 |
| Figure 2: Density histogram for toads. |
 |
| Figure 3: Density histogram for iab. |
 |
| Figure 4: Density histogram for adaptive. |
In order to facilitate comparisons of the parameters, the mean sky level in the reference image has been added back to the output from iab for consistency with the other implementations where the sky on the reference image is retained. In both cases the value used was taken from the catalogue file SKYLEVEL keyword.
Comparing the statistics embedded in the plots, and the forms of the plots themselves, indicates that the three implementations give very similar visual results for this test although the shape of the cumulative histograms are subtly different.
The value of sigma around the peaks seen in Figures 1-4, is critically dependent on the background following built into the algorithms and also the effective degree of smoothing (resulting in correlated noise) in the shifted matched image due to both interpolation and the adaptive kernel implementation.
Images with different seeing (runs 321392 seeing 1.5 arcsec and 321493 seeing 1.0 arcsec) were differenced and the results for CCD 4 are shown. The density histograms for simple, toads, iab and adaptive are included in Figures 7, 8, 9 and 10 respectively. The cumulative fraction histogram for the images is included in Figure 11, and sample sections of the input and difference maps are shown in Figure 12.
 |
| Figure 7: Density histogram for simple. |
 |
| Figure 8: Density histogram for toads. |
 |
| Figure 9: Density histogram for iab. |
 |
| Figure 10: Density histogram for adaptive. |
Different seeing - larger region
Using the same images as above we can get a better idea of the results from the three adaptive kernel algorithms from a larger section of the Halpha images of M33 from which the small extracts above were reproduced. The difference images are all scaled to display the same dynamic range in terms of (original maps) sigma above and below "sky", but at a contrast level twice that of the original images to reveal fainter artefact detail. A point to note, that is not directly obvious from the figures, is that the three methods introduce somewhat different spatial noise covariance functions in the difference images. This is due to a combination of the interpolation required to coalign the pixels prior to image subtraction and the blurring inherent in the kernel smoothing.
In order of appearance: reference image, target image, difference images target - reference in order toads, iab, adpative.