

Model simulations of WFCAM data were performed using the IRAF artdata and Terapix Skymaker software, mainly concentrating J-band data using the artdata software for the simulation of fields containing both stellar objects and galaxies. Both non-interleaved 2048x2048 and interleaved 4096x4096 images were generated and used to evaluate the output of the CASU imcore_conf source extraction software and SExtractor in their default modes, not tuned for WFCAM style data as yet.
The main conclusion of the report is that the limiting magnitudes attained are very close to those used in designing the UKIDSS survey. Details of limiting magnitudes, completeness statistics and morphological classification reliability are presented using imcore_conf and SExtractor. Although both packages perform almost identically in terms of image detection, the classification of images is much more reliable and robust in imcore_conf.
A summary of the WFCAM sensitivity measurements obtained from these simulations is included in the table, below.
| |||||||||||||||
| Summary table of sensitivity from simulations using imcore_conf. Images were 2x2 interleaved (4096x4096 pixels at 0.2'' per pixel), with 0.6'' seeing at 40 seconds total exposure time. Limiting magnitudes are at 5-sigma, and the magnitudes at 50% completeness have been derived from the stellar images in a high galactic latitude field. Magnitudes include derived stellar aperture corrections. |
A series of model simulations of expected WFCAM data have been made in order to evaluate the reliability of the parameter output from the catalogue extraction software, and to enable the comparison of the CASU imcore_conf program and SExtractor using realistic images. These packages were used in their default modes with no tuning for WFCAM-style data performed.
Two packages for such simulations were considered: artdata in IRAF and the Terapix simulation software consisting of Stuff and Skymaker. The IRAF artdata tasks were used for most of the simulations due to problems with the galaxy generation in the Terapix software producing too many galaxies of low surface brightness.
A series of test frames were made using the typical values for the WFCAM parameters listed in Table 1, below. Frames for a single 2048x2048-pixel detector in the WFCAM mosaic, and a set of four with identical objects but randomised noise to produce a 2x2 interleaved 4096x4096 image, were generated. The images for the interleaved output were combined with a separate C program.
| |||||||||||||||||||||||||||||||||||||||||||||||||||||||||||||||
| |||||||||||||||||||||||||||||||||||||||||||||||||||||||||||||||
| |||||||||||||||||||||||||||||||||||||||||||||||||||||||||||||||
| |||||||||||||||||||||||||||||||||||||||||||||||||||||||||||||||
| Table 1: Parameter set for simulations at 2048x2048. Parameters marked (*) were varied during some simulation runs. For the H, K and Z passbands only the parameters which were different from J are listed. The zeropoints and sky brightnesses are quoted for e-/second. |
Where appropriate, typical parameters were taken from the UKIRT WWW pages. The sky brightness values were taken from the instrumental parameters page for the UFTI instrument. The zeropoints are WFCAM estimates courtesy of Mark Casali.
The software was configured to use a Moffat profile with beta = 2.0 for consistency with previous WFCAM simulations. Further details of the parameters can be found in the help pages for the mkobjects, starlist and gallist tasks in the IRAF artdata package. Both the stars and galaxies were generated using a power-law luminosity function.
The simulations with artdata were run in four separate stages, for the first three using only the J passband. During the first stage, a set of 20 images was generated at 2048x2048 with 0.4'' sampling, and another at 4096x4096 with 0.2'' sampling. These were used for the analysis when seeing and star densities were kept constant. For the 2048x2048 images, a 40-second exposure consisting of four readouts at 10 electrons read noise was simulated in each case. For the interleaved 4096x4096 images, a single 40-second exposure (ie. four 10-second exposures, interleaved) was simulated. These images were used for the analysis under Completeness, Classification, Astrometry and Photometry.
A further set of simulations was run at 4096x4096 to generate 5 images at each of 15 equally spaced logarithmic intervals with numbers of stars per frame varying between 2000 and 50,000, to simulate variation between high and low galactic latitudes, used for the analysis under Stellar density. Another set of images were a run at 4096x4096 with seeing varying between 0.4 and 2.2 arcseconds at 0.2 arcsecond intervals, for the analysis under Seeing.
A set of simulations were run at 4096x4096 to generate 20 images with a linear background gradient from the corner (1,1) to (2048,2048) on each of the 2048x2048 images which were interleaved, to test the background subtraction in imcore_conf and SExtractor. This was done from 1% below the background level (in Table 1) at (1,1) to 1% above at (2048,2048). These simulations were used for the analysis under Background gradients.
The final set of simulations with artdata were a run at 4096x4096 to produce 20 images in each of the passbands (ie. generating additional H, K and Z images), at high galactic latitude. These were analysed only with imcore_conf, to produce the plots under Completeness in Z,J,H,K passbands. An additional 5 images at low galactic latitude (with 33000 stars per frame) were also produced to generate the limiting magnitudes in Table 5.
An additional set of simulations at high galactic latitude were run at 4096x4096 using Skymaker to produce a set of 20 images in the J passband, for the purposes of comparing the output of artdata (used for the remainder of the simulations) and Skymaker under Simulations with Skymaker. Due to the problems with the galaxy generation, the fields contain only stellar images. The version of Skymaker used was locally modified to produce images with Moffat profiles with beta = 2, for consistency with the simulations using artdata. Note that this package simulates extra effects such as the diffraction pattern of the telescope entrance pupil and saturation, which are not simulated by artdata. A full-well capacity of 200,000 electrons was used for the saturation level. It should be noted that Skymaker simulates CCD saturation effects such as charge bleeding along columns, which are not relevant for the Hawaii II NIR detectors.
After each simulation run, the lists of actual object positions and parameters in the images were filtered to remove any outside the range of the detector, to avoid affecting the completeness statistics.
The generated sets of images were used as input to both imcore_conf and SExtractor to generate a series of source catalogues. These were then matched with a catalogue generated from the list of ``correct'' source parameters output by artdata using a modified version of existing matching software used for the INT wide field camera. A series of Perl scripts was used to analyse these matched files and to produce the plots and statistics in the sections below. These performed additional rejection of any bad matches from the match program by rejecting any objects matched with positional errors (the difference between the positions in the two catalogues) of more than 1''.
SExtractor was configured such that the parameters, in particular photometry, generated were as similar as possible to the output of imcore_conf to facilitate comparisons of the packages. The FLUX_APER fluxes from SExtractor were used throughout, with the detection thresholds set to be the same in both packages, with a 4-pixel minimum source area, detection at 1.5 sigma, and core radii equal to the seeing in pixels, clipped to a minimum value of 2 pixels: eg. for the 0.6 arcsec seeing cases, the values were 2 pixels for the 2048x2048 and 3 pixels for the 4096x4096 pixel images.
SExtractor "cleans" the output catalogue by removing objects it considers to be spurious detections. Since no classification value is emitted for such objects, this option was left enabled to avoid polluting the results for the stars and galaxies with spurious objects.
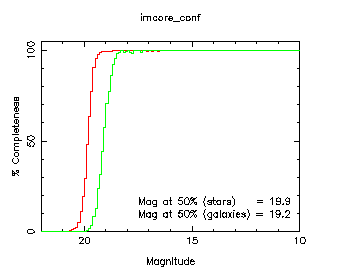
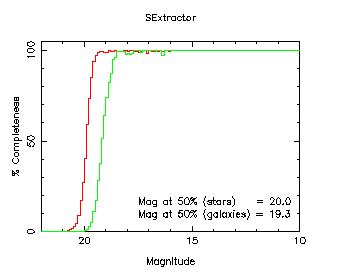
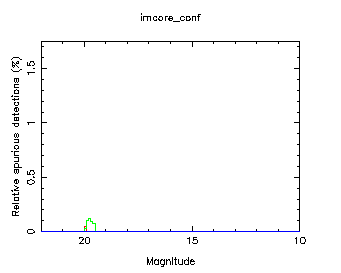
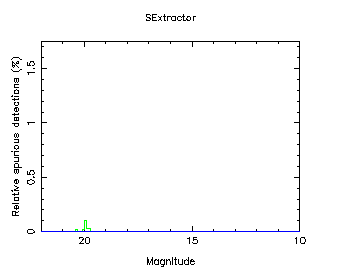
The completeness was evaluated by plotting the percentage completeness (ratio of the number of correctly detected objects to the total number of objects) as a function of magnitude, binned at 0.1 mag intervals, and the relative number of spurious detections (number of objects detected without a corresponding object in the input list, divided by the number of objects at that magnitude in the input list) also as a function of magnitude. Figures 1 and 2 show the results for both imcore_conf and SExtractor.
 |
 |
 |
 |
| Figure 2: Relative number of spurious objects detected as a function of magnitude. Objects classified as stars, galaxies and noise objects are plotted in red, green and blue respectively. | |
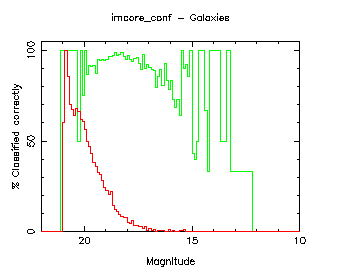
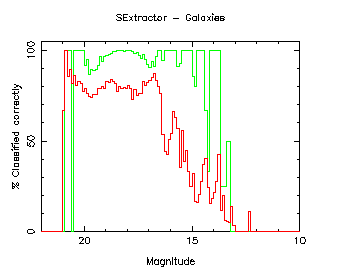
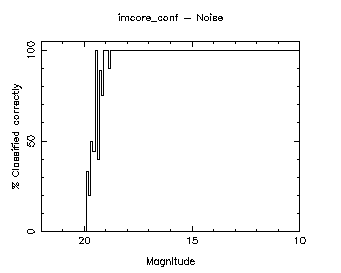
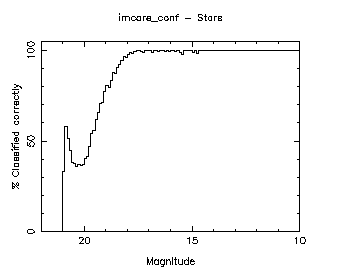
The object classification accuracies of both imcore_conf and SExtractor were evaluated by plotting the percentages of stars, galaxies and noise objects (for imcore_conf only: the SExtractor classifier does not identify these) classified for each package. These plots are included in Figures 3, 4 and 5 respectively.
 |
 |
 |
 |
| Figure 4: Percentage of galaxies classified as galaxies (green line) and percentage of stars classified as galaxies (red line) as a function of magnitude. | |
 |
 |
| Figure 5: Percentage of noise objects classified successfully as a function of magnitude. The left-hand plot is at 2048x2048, the right-hand plot at 4096x4096 (imcore_conf only). | |
The ``noise'' seen in Figures 3 and 4 for the non-interleaved 2048x2048 images is due to pixellation (undersampling) in the images, and is not present in the interleaved versions of the frames, as demonstrated by the plots.
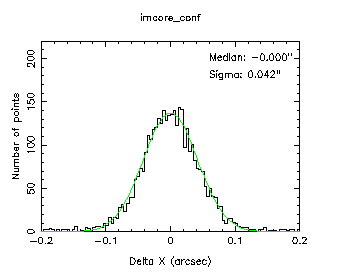
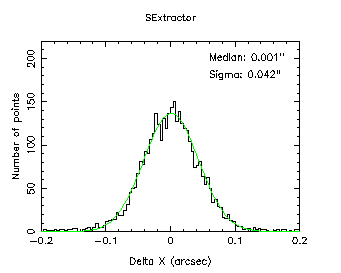
The coordinate accuracies were evaluated by plotting the error (difference in the coordinate between the reference and generated catalogues) as a function of magnitude for the x direction (Figure 6). The plots for the y direction are near identical and were therefore omitted. A cut at magnitude 18 (Figure 7) was also plotted and has been overlaid with a Gaussian of the same standard deviation, calculated using a robust MAD estimator.
Cosmic rays have been excluded in forming the plots below, so that only the actual objects contribute.
 |
 |
 |
 |
| Figure 7: Cut across Figure 6 at magnitudes 17.5 to 18. | |
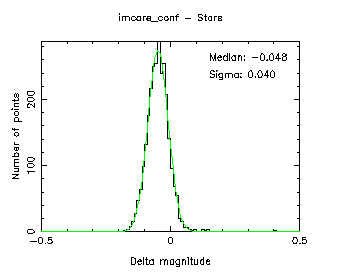
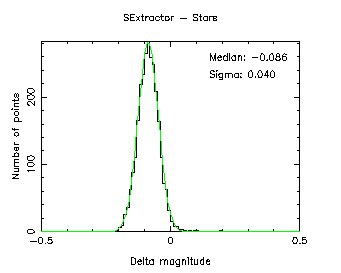
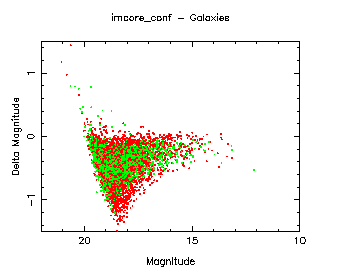
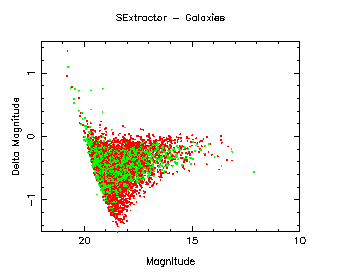
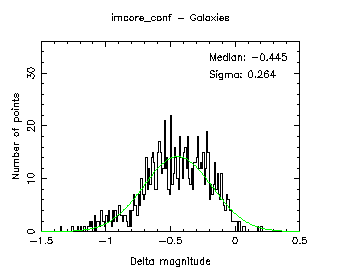
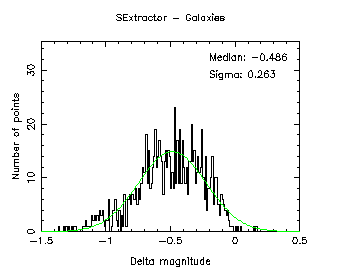
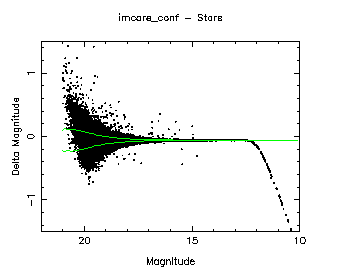
The photometric accuracy was evaluated through plots of the difference in magnitudes between the reference and derived parameters as a function of magnitude (Figure 8 - stars, Figure 10 - galaxies) and a cut at magnitude 18 (Figures 9 and 11) were used. The plots of cuts (Figures 9 and 11) have been overlaid with Gaussians of the same standard deviation, calculated using a robust MAD estimator.
Aperture corrections were applied to the fluxes from SExtractor, calculated as the median difference between the Kron aperture (FLUX_AUTO) magnitude and the FLUX_APER magnitude used here, for objects which were classified with a ``stellaricity'' index (probability of being a star) greater than 0.5.
Cosmic rays have been excluded in forming the plots below, so that only the actual objects contribute.
 |
 |
 |
 |
| Figure 9: Cut across Figure 8 at magnitudes 17.5 to 18 (stars). | |
 |
 |
 |
 |
| Figure 10: Magnitude difference (reference - generated) as a function of magnitude (galaxies: red - spirals, green - ellipticals). | |
 |
 |
 |
 |
| Figure 11: Cut across Figure 10 at magnitudes 17.5 to 18 (galaxies). | |
The small offsets of approximately 0.05 and 0.08 magnitudes (non-interleaved and interleaved images respectively) for imcore_conf and 0.09 and 0.16 magnitudes for SExtractor, seen in Figure 9, are due to the difficulty of estimating the object curve of growth using the current limited set of apertures for the flux. This problem will be solved in a later version of imcore_conf when the set of extra larger apertures proposed for the WFCAM pipeline are implemented.
Behaviour as a function of stellar density
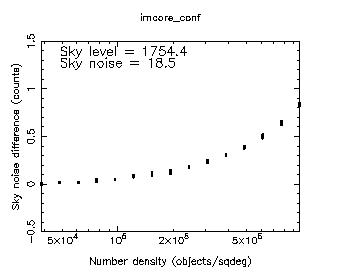
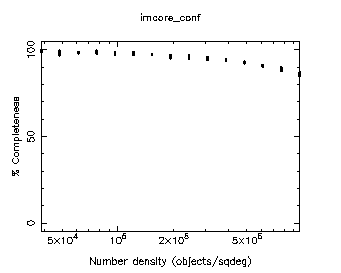
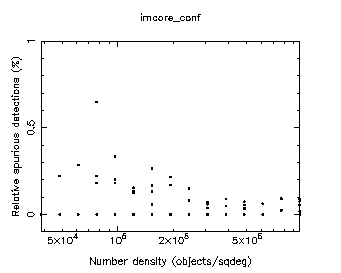
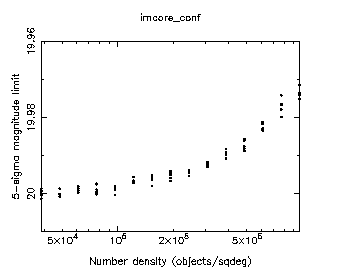
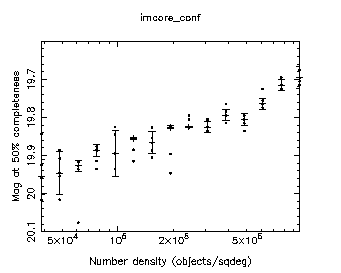
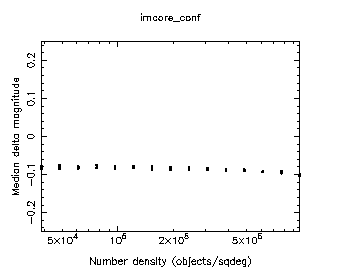
The performance of each package as a function of the density of objects on the frame was evaluated using the series of files with variable stellar object densities described above. Plots of the differences in sky level and sky noise from the reference as a function of the number density of the objects are included in Figures 12 and 13. Plots as a function of the number density of the percentage completeness for stellar objects at magnitude 19 (Figure 14), relative number of spurious source detections (Figure 15, also at magnitude 19), 5-sigma limiting magnitude (Figure 16), magnitude at 50% completeness for stellar objects (Figure 17) and median magnitude difference (Figure 18, at magnitude 16) were also made.
 |
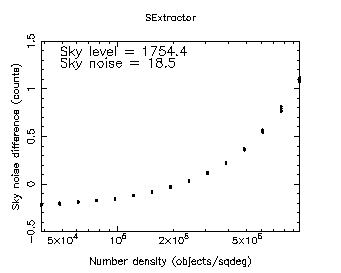 |
| Figure 13: Difference in estimated sky noise as a function of object density. | |
 |
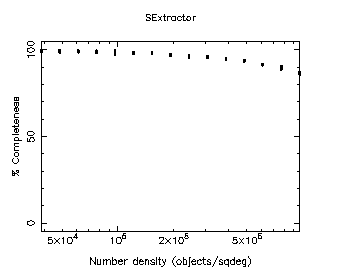 |
| Figure 14: Completeness (for stellar objects) as a function of object density at magnitudes 19.0 to 19.5. | |
 |
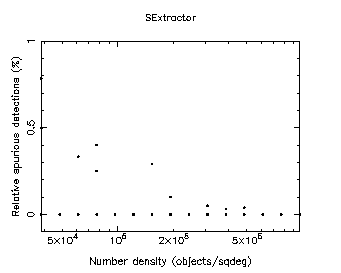 |
| Figure 15: Relative number of spurious detections as a function of object density at magnitudes 19.0 to 19.5. | |
 |
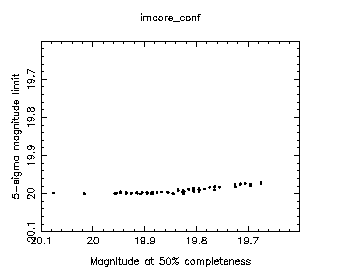 |
| Figure 16: 5-sigma limiting magnitude as a function of object density (left) and 5-sigma limiting magnitude against magnitude at 50% completeness (right). imcore_conf only. | |
 |
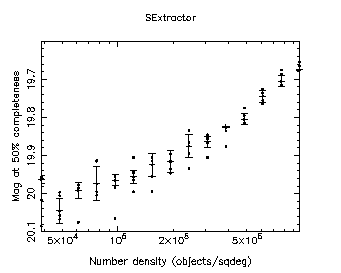 |
| Figure 17: Magnitude at 50% completeness (for stellar objects) as a function of object density. | |
 |
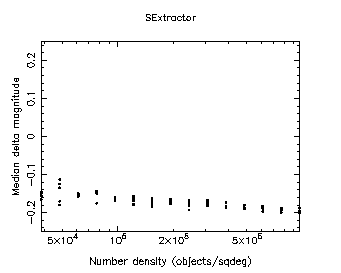 |
| Figure 18: Median magnitude difference as a function of object density at magnitudes 15.9 to 16. | |
Behaviour as a function of seeing
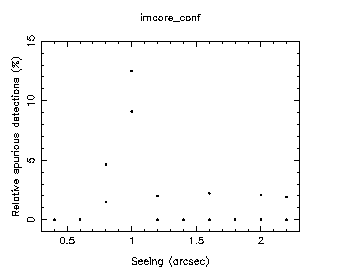
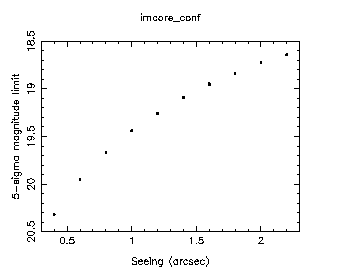
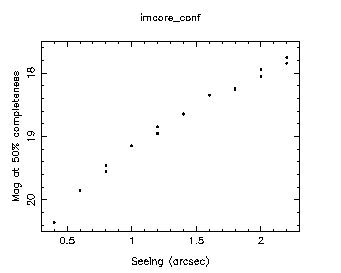
The performance of the packages as a function of seeing was evaluated using the series of files with variable seeing described above. Plots as a function of seeing of the percentage completeness for stellar objects (Figure 19), relative number of spurious source detections (Figure 20), 5-sigma limiting magnitude (Figure 21) and magnitude at 50% completeness (Figure 22), estimated seeing and average stellar ellipticity, for imcore_conf only (Figure 23) and median magnitude difference (Figure 24) were made. There are two measures at each value of the seeing on the plots.
 |
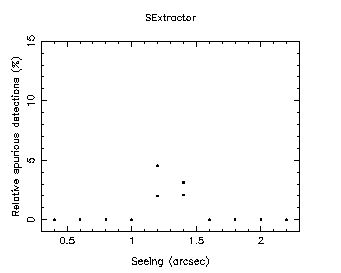 |
| Figure 20: Relative number of spurious detections as a function of seeing at magnitudes 18.9 to 19. | |
 |
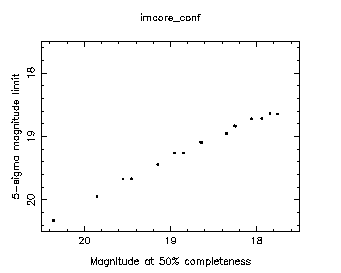 |
| Figure 21: 5-sigma limiting magnitude as a function of seeing (left) and 5-sigma limiting magnitude against magnitude at 50% completeness (right). imcore_conf only. | |
 |
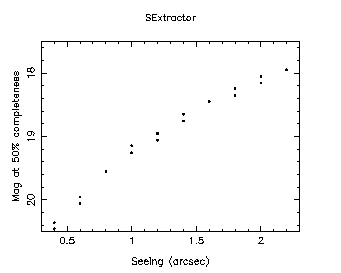 |
| Figure 22: Magnitude at 50% completeness (for stellar objects) as a function of seeing. | |
Completeness in Z, J, H, K passbands
The completeness in each of the Z, J, H and K WFCAM passbands was evaluated by plotting the percentage completeness as a function of magnitude for each. These plots are included in Figure 25. Figure 26 shows the corresponding relative numbers of spurious detections.
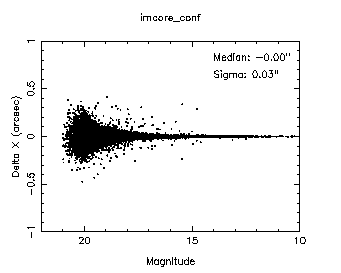
The set of simulations on stellar fields using Skymaker were used to generate plots of the completeness and number of spurious detections as a function of magnitude (Figures 27 and 28), the number of stellar images classified successfully (Figure 29), and the analogues of Figures 6-9 (Figures 30-33) from Astrometry and Photometry.
 |
 |
| Figure 28: Relative number of spurious objects detected as a function of magnitude. Objects classified as stars, galaxies and noise objects are plotted in red, green and blue respectively. | |
 |
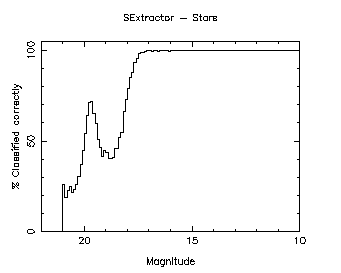 |
| Figure 29: Percentage of stars classified successfully as a function of magnitude. | |
 |
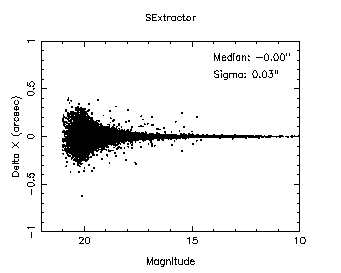 |
| Figure 30: X coordinate difference (reference - generated) as a function of magnitude. | |
 |
 |
| Figure 31: Cut across Figure 30 at magnitudes 17.5 to 18. | |
 |
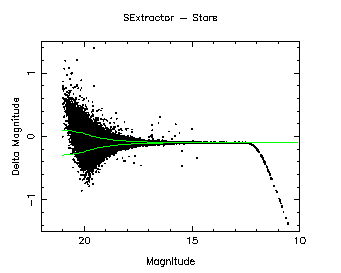 |
| Figure 32: Magnitude difference (reference - generated) as a function of magnitude (stars). | |
 |
 |
| Figure 33: Cut across Figure 32 at magnitudes 17.5 to 18 (stars). | |
The large numbers of spurious detections seen in the Skymaker output have been identified to lie mostly within the haloes of bright stars on the images. These are simulated by Skymaker but not by artdata, so this effect was not seen for the equivalent plots under completeness.
The J-band limiting magnitudes for Skymaker at high galactic latitude are summarised in Table 3, below.
| |||||||||
| Table 3: J-band limiting magnitudes at 5-sigma and magnitude at 50% completeness for Skymaker, compared to the values for artdata. |
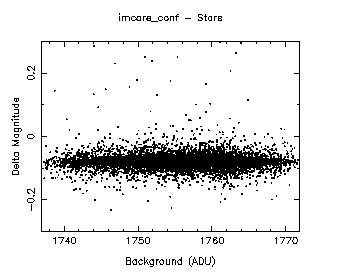
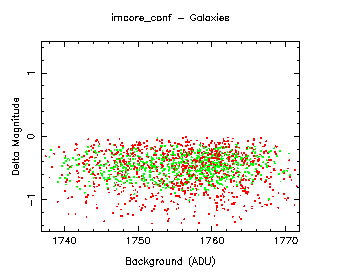
A simple background gradient in an interleaved set of images was used to test the background subtraction. Plots of the magnitude difference as a function of the background level across the frame for stars (Figure 34) and galaxies (Figure 35) were made. These plots use only the images between magnitudes 18 (approximately 2 mag. above the detection limit) to 10 to avoid masking any effects in the noise.
 |
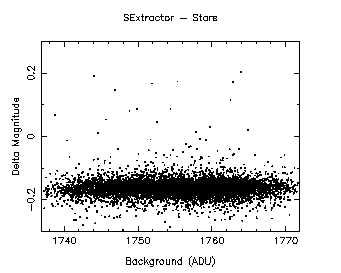 |
| Figure 34: Magnitude difference (reference - generated) as a function of background level (stars). The images were 2x2 interleaved with 0.2 arcsec effective sampling. | |
 |
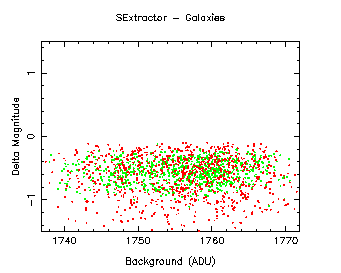 |
| Figure 35: Magnitude difference (reference - generated) as a function of background level (galaxies: red - spirals, green - ellipticals). | |
The lack of any visible systematic change in the magnitudes from left to right on these plots indicates that the gradient does not affect the flux estimation in either imcore_conf or SExtractor, and hence both background following algorithms successfully remove the linear gradient.
Timings of imcore_conf and SExtractor runs on the set of images with constant density and seeing parameters were made to assess the relative performance of these packages. The tests were run over 20 files at each of the resolutions (2048x2048 and 4096x4096) used, averaging the resulting timings. The CASU classifier, fitsio_classify, was not tested since timings were only to a one second resolution and a typical run of this program took only approximately a second or less.
All tests were carried out on a dual-CPU AMD Athlon 2000MP computer with 1GB RAM, running Redhat GNU/Linux 7.3, with the files stored on a 1Tbyte Infortrend IDE RAID device running in a RAID 5 configuration on 7 IDE 160GB disks. The timings obtained are listed in Table 4.
| |||||||||
| Table 4: Timings for imcore_conf and SExtractor runs. |
The obtained values for the limiting magnitudes at 5-sigma using imcore_conf are compared here with the estimates on the WFCAM technical page.
For J, the measured 5-sigma detection limit is between magnitudes 19.98 and 19.96, using a seeing value of 0.6'' and a 1.2'' diameter aperture to measure the flux.
Using the values on the sensitivity page gives a limiting J magnitude for a 40-second interleaved integration of 19.3, using a 2'' diameter aperture. The correction for the difference in noise between the apertures is 0.5 magnitudes, giving a value of 19.8 for a 1.2'' aperture. The values for all four passbands are summarised in Table 5.
| ||||||||||||||||||||||||
| Table 5: Limiting magnitudes at 5-sigma obtained from simulations, including derived stellar aperture corrections. The offset described in photometry has been removed from the magnitudes in this table. | ||||||||||||||||||||||||
Comparison of imcore_conf and SExtractor
The results shown above demonstrate that overall, these two packages are very similar. In particular, the tests of completeness, astrometry and photometry show very similar results in both cases. The tests at varying stellar density and seeing also demonstrate the similarity of the output from these two packages.
The major difference between these packages is in the object classification algorithms, and it is therefore unsurprising that some differences were observed under classification. The CASU classification software, fitsio_classify, uses a statistical approach based on the parameters produced by imcore_conf, whereas SExtractor uses an artificial neural network, taking as it's input the eight isophotal area parameters, the ratio of object peak intensity to the analysis threshold, and the seeing.
The differences between the two classification techniques are reflected in Figures 3 and 4. The performance on galaxies shown in Figure 4 is similar for both packages.
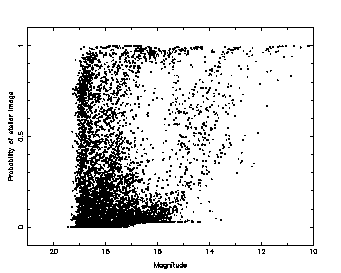
The performance on stellar images in Figure 3 shows considerable differences. Here, the classification accuracy drops off for SExtractor from approximately magnitude 15 compared to between magnitude 17 and 18 for fitsio_classify on the interleaved images. The classification for SExtractor is again less reliable for the non-interleaved images, starting to fall from 100% at magnitude 13, compared to approximately 17 for fitsio_classify.
The effects observed reflect the uncertainty in the SExtractor ``stellaricity'' output at these magnitudes. Figure 36 shows a plot of this parameter versus magnitude for four typical interleaved and non-interleaved images.
 |
 |
| Figure 36: SExtractor probability of a stellar image (``stellaricity'') versus magnitude for non-interleaved (left) and interleaved (right) images. | |
The effect observed in SExtractor for the stellar images is most likely to be due to two factors: the undersampling of the images (in particular in the non-interleaved case), and the small value of the Moffat profile parameter beta used in the simulations. The SExtractor neural network classifier was trained for operation on images with seeing in the range of 1.5 to 5 pixels, meaning that the images used are at the lower end of this range, and for Moffat profiles with beta between 2 and 4, again placing the values used at the lower end of the range. Hence the extreme of the SExtractor neural network training range is being tested here, and this may explain the relatively poor performance seen on the stellar images.