The questions that need answers are:
| Filter | Sky Level | Sky Noise |
| Z | 150-250 | 6-8 |
| Y | 370-400 | 8-12 |
| J | 850-2500 | 15-30 |
| H | 6500-8500 | 40-60 |
| K | 3000-6500 | 25-40 |
The above table gives typical values for the sky level and RMS noise (in counts) for single frames (no stacking nor interleaving). If there is a need for persistence removal, then a good target to aim for would be to reduce the persistence to about the level of the RMS noise.
Note that the example (20050409_01347) given in the SV report was a 5 point jitter pattern, no interleaving with 5 second exposures (~9 seconds between each exposure start). The example is also stacked so complicates the issue further.

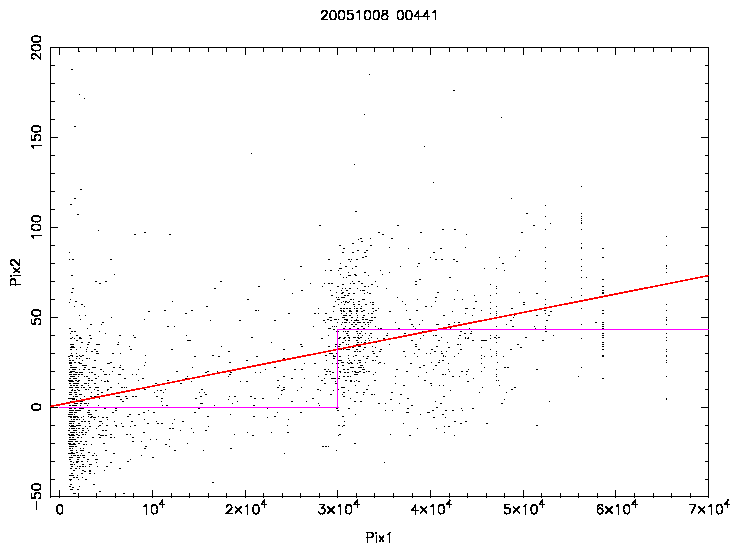
The above shows pixel value on primary frame versus pixel value on the secondary frame for areas around the 10 brightest images of a frame. Two possible models were fitted to the data: a gradient and a step function. A step function would be safer to implement since only small parts of the frame would have to be corrected. As can be seen, this data is very noisy. Note that the true illumination levels in the first frame are not measured in the regions of saturation. The result is that there is no clear answer from this sort of comparison.
Are persistent images top hat or bell-shaped? This could help in deciding whether the relationship is a gradient or step function. A slight complication might be intrapixel capacitance which is at the 20% level, so there might be a spread due to this of about 1 pixel.
Initial studies found that the persistent image was a Gaussian of the same width as the saturated area of the perturbing star in the previous frame. However, later examples show that the persistent image tends to have a flat top. This leads to a
Simple model:
Determining the extent of the saturated area is not straightforward due to the counts decreasing after saturation (about 30000 counts). A procedurally easy method is to run the catalogue generating software (imcore) on the first frame with a much higher threshold than normal so that the areal profiles can be used to characterize the saturated area.
| 
|
|
|
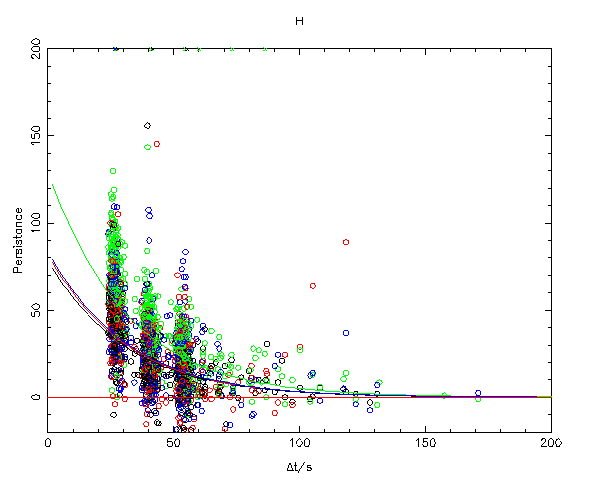
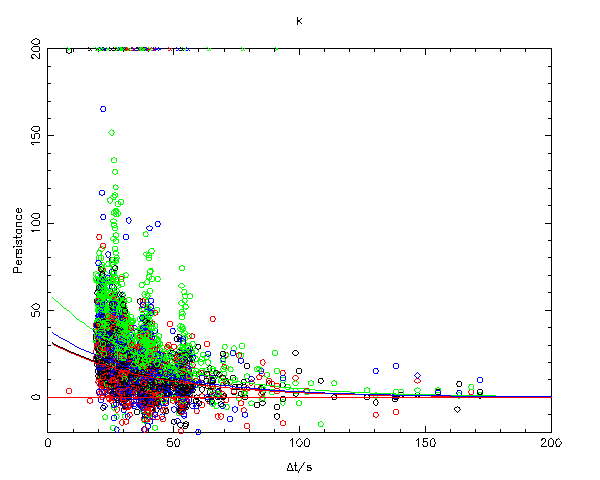
The above plots measured persistence (using the simple model) versus the difference in start times between the two frames. Note that the typical delta-t between two consecutive frames is about 25 seconds. The model chosen to fit the data was an exponential decay with the decay rate constant for each filter, but the scale being chip dependant. Thus the model has 5 parameters per filter.
General properties:
The above data is very noisy - more than would be expected from measuring errors. A possible explanation for this could be overlapping real images causing problems for the persistence measurement. Tests were carried out using only LAS data, where the images are quite sparse, and the results were just as noisy, thus eliminating this explanation.
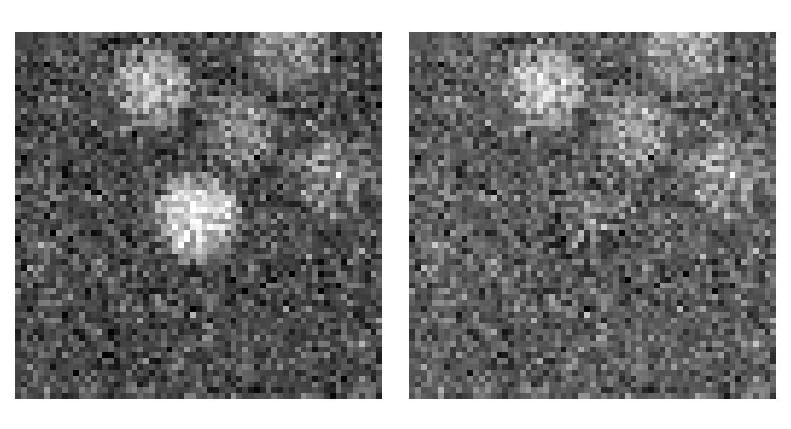
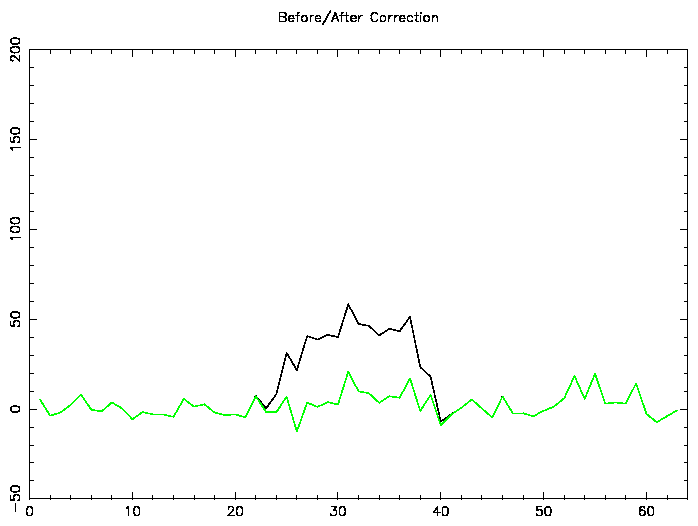
Note that the above is a selected example of a correction that works. Most persistent images are not corrected as well as this.
This indicates that the simple model would only be accurate at the 10-20 counts level. In these tests, it was found that using the simple model and the decay characteristics measured above, the model was sometimes in error by 20-30 counts.
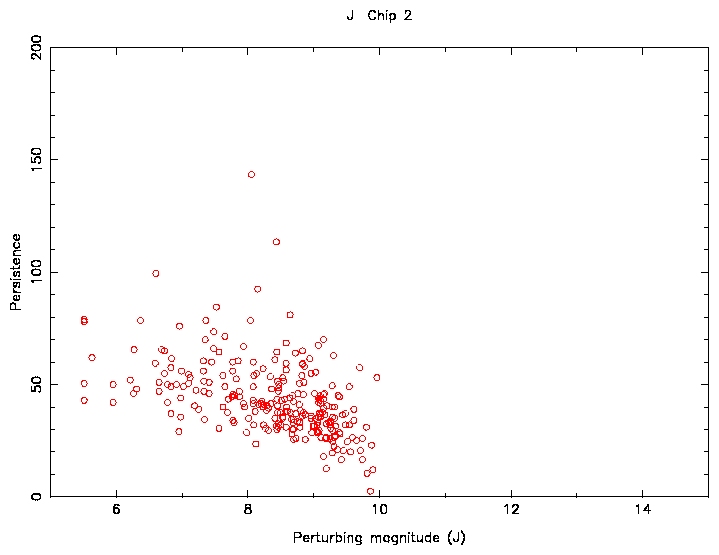
A more extensive study to try and account for the above magnitude effects showed similar results. In the above plot the data was limited to a delta-t of around 25s in order to remove the decay rate from the analysis. The perturbing magnitude was calculated using 2MASS data (thus not affected by saturation) and a contribution from sky flux. Although a magnitude correlation is seen, the scatter in the measured persistence is still larger than the expected measuring error. Typically, it is larger than the average value of the persistence.
Further work was carried out on Z and Y data since the persistence level is higher and the sky noise level is lower for these filters. Even though this signal to noise was better than for the JHK data, the scatter in the persistence remained high.

This plot shows a possible relationship between illumination and persistence. This would explain the flat(ish) top hat shape for the persistent image and why the persistent image tends to be brighter with a brighter perturbing star.
A practical problem with applying a model like this is saturation effects: the illumination level can't be measured directly for the brighter stars. A possible method around this is to use 2MASS to provide the illumination levels. Each bright 2MASS entry would have a PSF generated for it, scaled appropriately for the first frame. This would then be transformed by a function similar to above, taking into account the decay rate. This would be subtracted from the frame containing the persistent image. Note that persistence can be detected not only in the immediately following frame, but in subsequent ones (see the above example).
Problems with the complicated model:
Interleaving complicates things. Using data from 20051008_00441/2, a star of magnitude J=8.8 leaves a persistent image about 8 magnitudes fainter. This is detected by imcore. When you interleave frames, not only has the telescope shifted by a fraction of a pixel, but it also moves by an integer amount due to matching the pixel scale in the autoguider. This means that the 4 persistent images (each fainter than the next due to the decay rate) are separated by 20 pixels. These are not detected by imcore. The effect of interleaving on the persistent image left by a 3.6 magnitude star was also checked. Although not detected per se, the persistent images did affect overlapping (real) images.
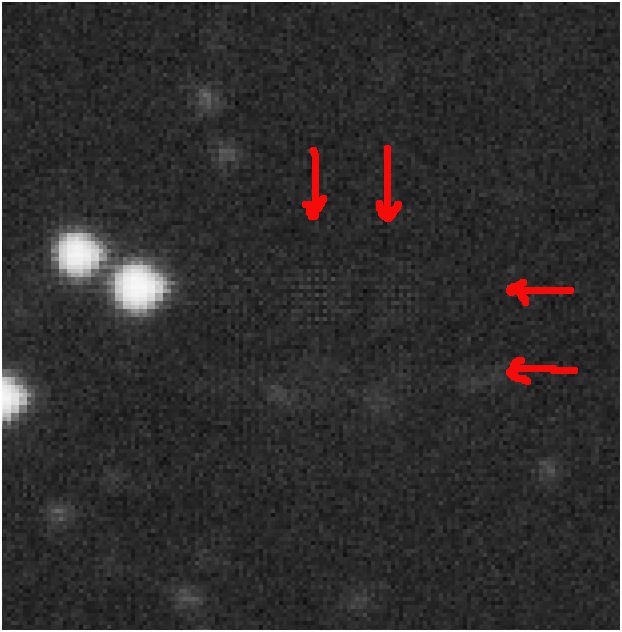
If you don't do interleaving, how much of a problem will persistence be? Using the catalogue data, you can work out the proportion of stars brighter than 9th magnitude (the limit needed to cause persistence). This proportion is between 0.1 to 0.3% ie. between 1/1000 and 1/300 images on a frame will be due to persistence. 3 LAS fields were checked in detail and no persistent image could be found, which is consistent with the above numbers.
Note that 95% of detected images that are caused by persistence are classified as non-stellar. The rest are classified as stellar.
Stacking frames will also complicate things. If a median or clipped mean is used, than the persistent pixels will be outliers and removed. However, if the same observing strategy is used each time, then the persistent pixels may not be outliers and still be visible.
For JHK frames, persistence does not seem to be a large and significant problem, even for non-interleaved data. If data is interleaved and stacked then the effect is reduced further. For Z and Y frames, where the level of persistence is high, the sky noise level is low and no interleaving is carried out, the number of detected images caused by persistence will be higher.
Although it is recommended that no correction for persistence be carried out, a possibility might be to flag catalogue entries that might be caused by persistence cf. 2MASS.
Here are 4 examples of persistence for you to look at.