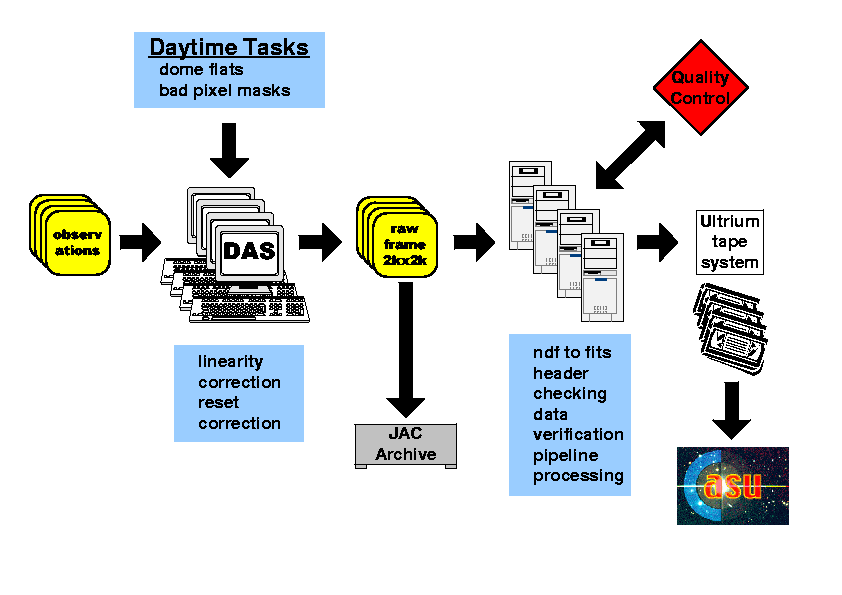
The main roles of the summit pipeline are to produce real time data quality control information, a first pass science product and to provide verified export raw FITS files for shipping to Cambridge.
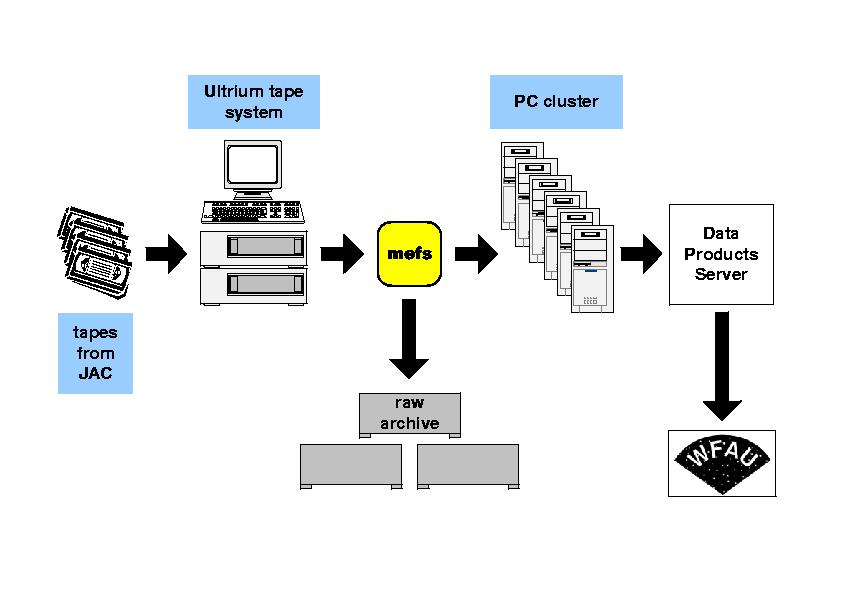
The overall schema for the proposed summit data flow is shown in the following diagram and is based on commodity rack-mounted PCs.
Pipeline processing in the UK is built on a modular system and involves three separate pipeline philosophies: the standard pipeline provides instrumental signature removal, object catalogue generation and astrometric and photometric calibration and operates on a nightly basis; likewise the nightly further processing pipeline will be used to generate spatially mapped oversampled PSFs for use in PSF fitting for stars and as the basis for Sersic profile fitting of galaxies; finally an advanced database-driven pipeline will run asynchronously via the science archive at WFAU to perform tasks such as deep stacking, mosaicing of contiguous regions, catalogue merging, list-driven photometry and photometric calibration refinement using overlaps of adjacent fields.
The Cambridge pipelines will be built around commodity PC clusters and will host an online raw data products archive and a data products server as a staging system for transfer of pipeline output to WFAU.
Initial data processing stages consist of:
For the standard pipeline we are intending to use 6 rack-mounted twin processor PC units running GNU/Linux, with each enclosure containing twin redundant power supplies, fans, dual Athlon processors (~3 GHz/s), with a ~1 Tbyte 3ware Escalade-based RAID5 IDE disk system. Two of these systems, the data archive server and the data products server will be interfaced to rack-mounted standalone Ultrium LTO-2 tape drive units (SCSI interface) and will be mainly used as data servers. The other four will be mainly used for data processing for the standard pipeline products.
With the details depending on the stability of the master calibration frames, we currently envisage using these data processing PCs in either a cyclical nightly hierarchy or for processing data split by filter(s) for each night.
External multi-terabyte RAID arrays based on the Infotrend controller (or similar) will provide the on-line storage for the raw data database server and for the data product server systems.
Operating system and processing software will be served from the two servers (one for redundancy) to the other data processing PCs to allow for software and operating system updates (eg. security patches) and further expansion of the cluster with minimal system manager intervention. Local disks will be used for any temporary storage.
The alternative approach of maintaining a separate operating system installation on each node is also under consideration, with the possibility of writing additional tools to automate the distribution of software updates. The use of an appropriate distribution of GNU/Linux, for example Debian or Redhat with the up2date tool, would facilitate this setup since operating system updates can be more easily automated. This would be based on a common "system image" taken from the same original GNU/Linux installation to allow for any future node replacements or additions and to maintain an identical setup on each node.
The whole PC cluster will be connected using 1 Gbit ports on a rack-mounted 3C17701-ME SuperStack III 4924 switch, which has 24 autosensing 10/100/1000BASE-T(RJ45) ports.
Following the link for the dataset shows the status of all the files within the dataset. The script currently extracts the status information from the fits headers; we are alos investigating the alternative of the pipeline writing the status to a noticeboard file instead - this would reduce i/o and speed up the monitoring script with the caveat of losing independance of the test.
This will be expanded to include diagnostics for all of the following parameters (per detector where appropriate):
Last modified: Fri Jun 27 07:25:27 2003