Clouds, Streams and Bridges
Redrawing the blueprint of the Magellanic System with Gaia DR1
The PDF of the discovery paper is (freely) available on the arXiv.
See also the companion paper
|
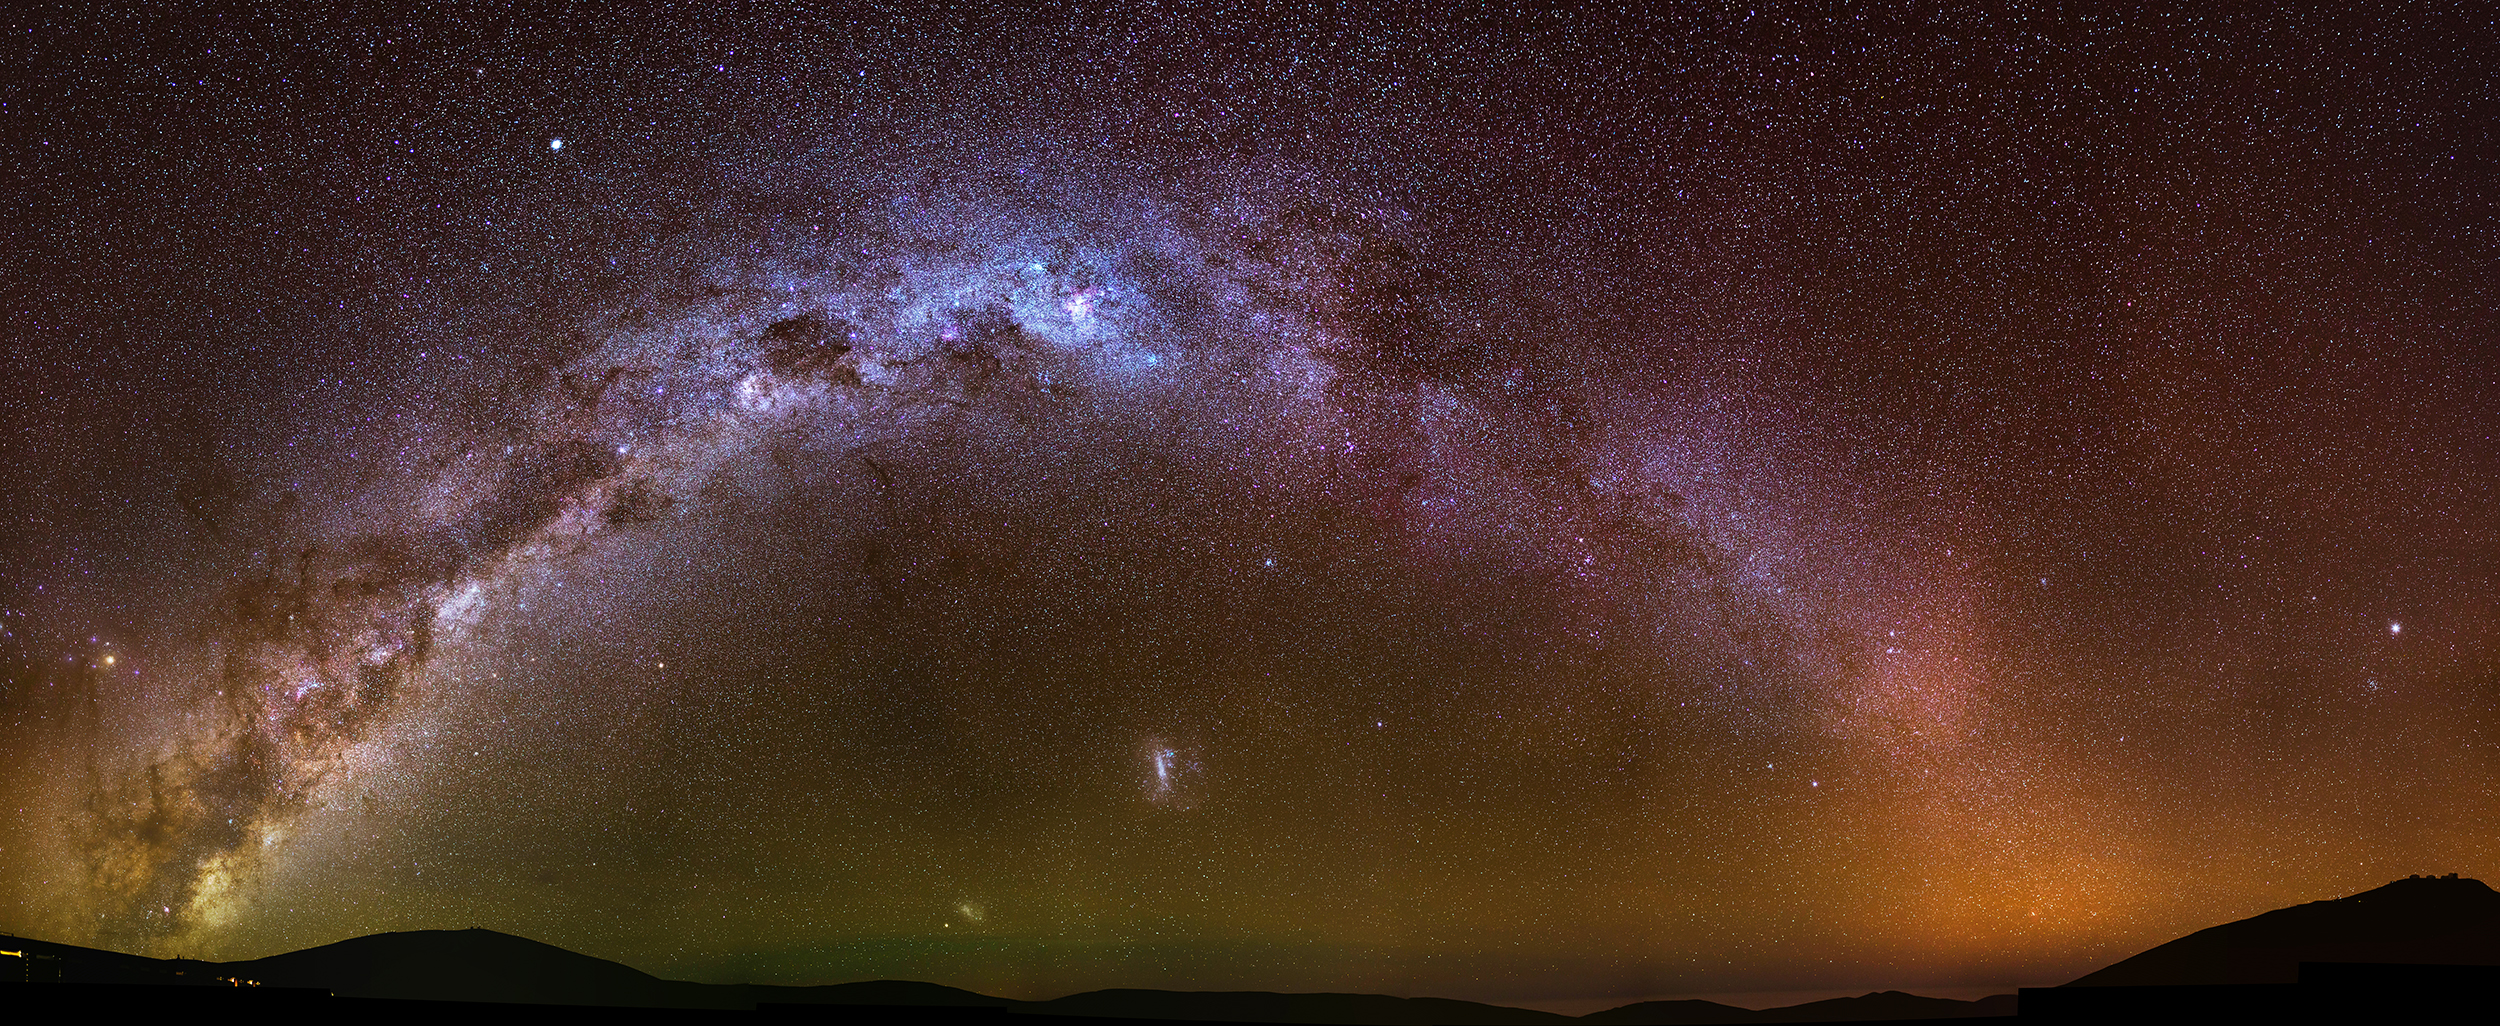
Panorama of the Milky Way galaxy and the Magellanic Clouds
|
|
Credit: D. Erkal (Cambridge, UK)
|
|
Caption: Denis took several tens of photoghraphs at the Paranal
observatory in Chile and stitched them together to produce this
panorama. The Milky Way is arching across the entire picture. The LMC
and the SMC can be seen just above the horizon.
|
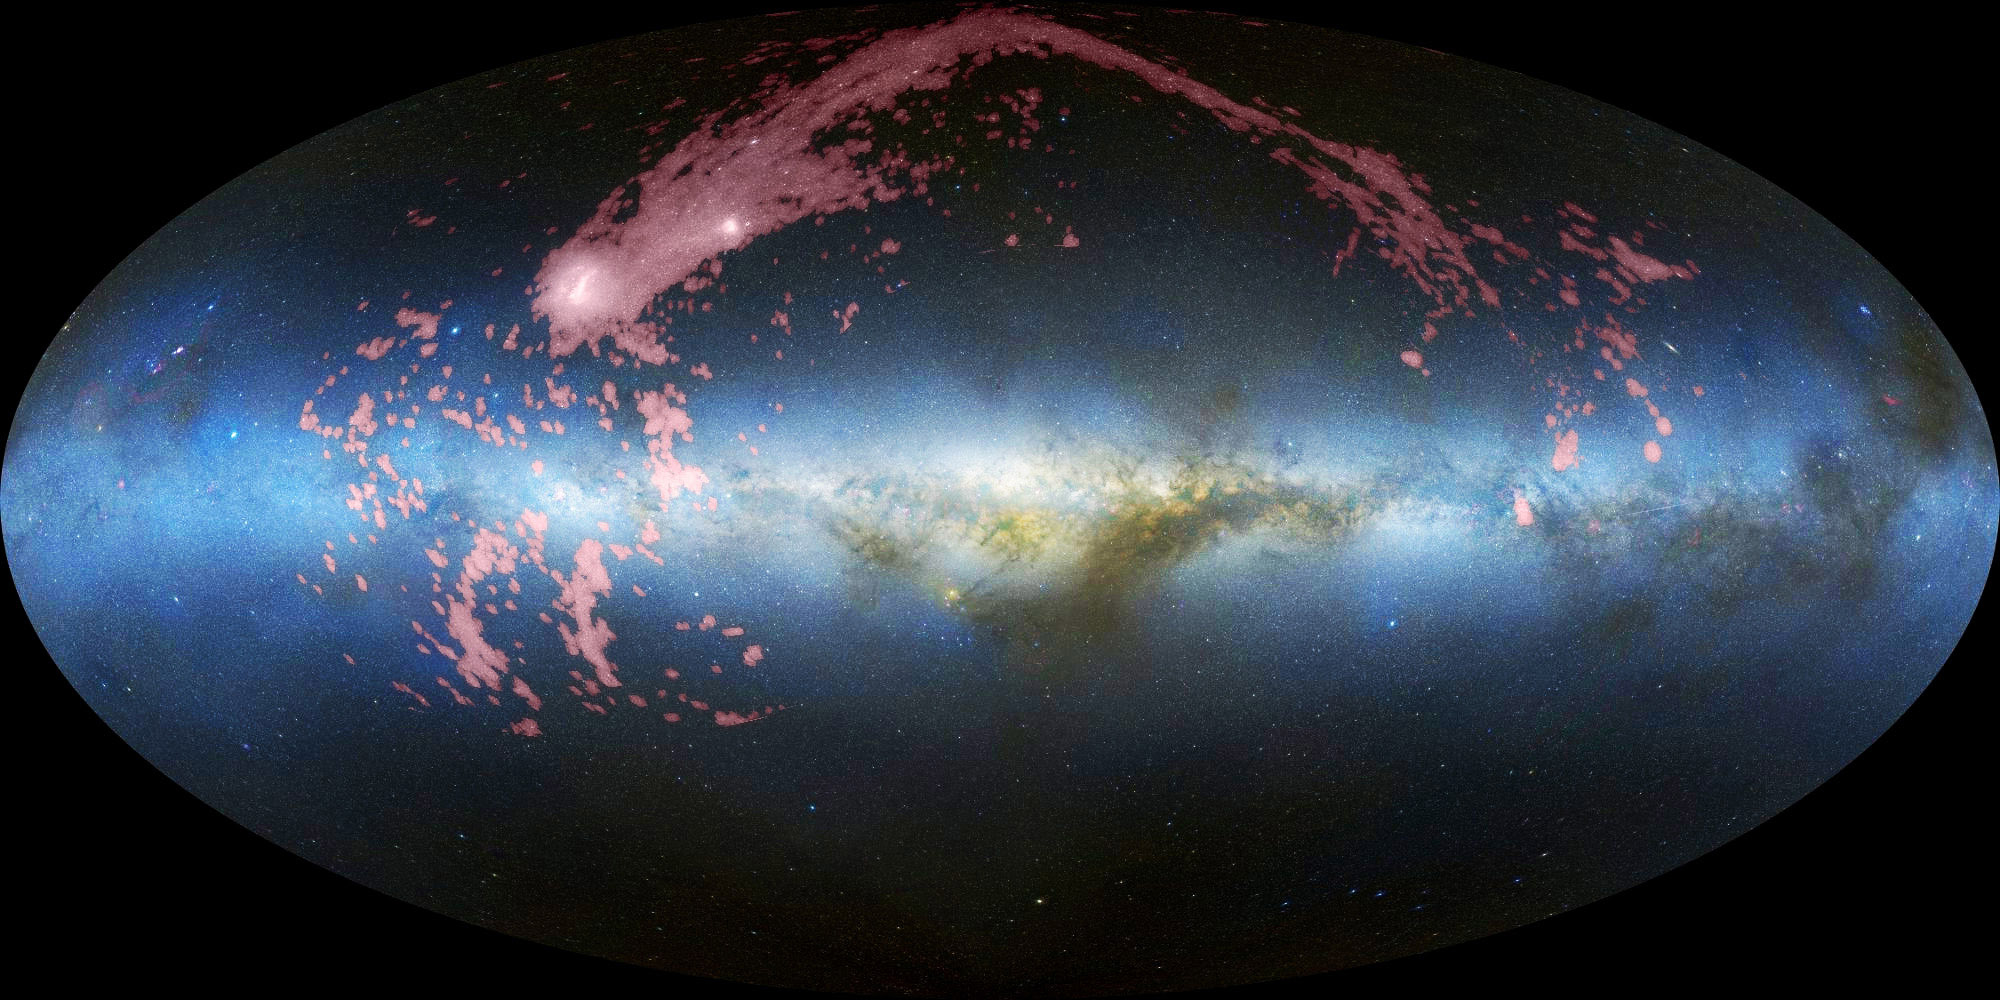
Magellanic Gaseous Stream and the Milky Way Galaxy
|
|
Credit: Full credit information can be found here
|
|
Caption: The red stream represent neutral hydrogen gas detected
using radio observations. The underlying photo is in optical. This
image is in "flipped" Galactic coordinates, i.e. the Galacti North is
down.
|
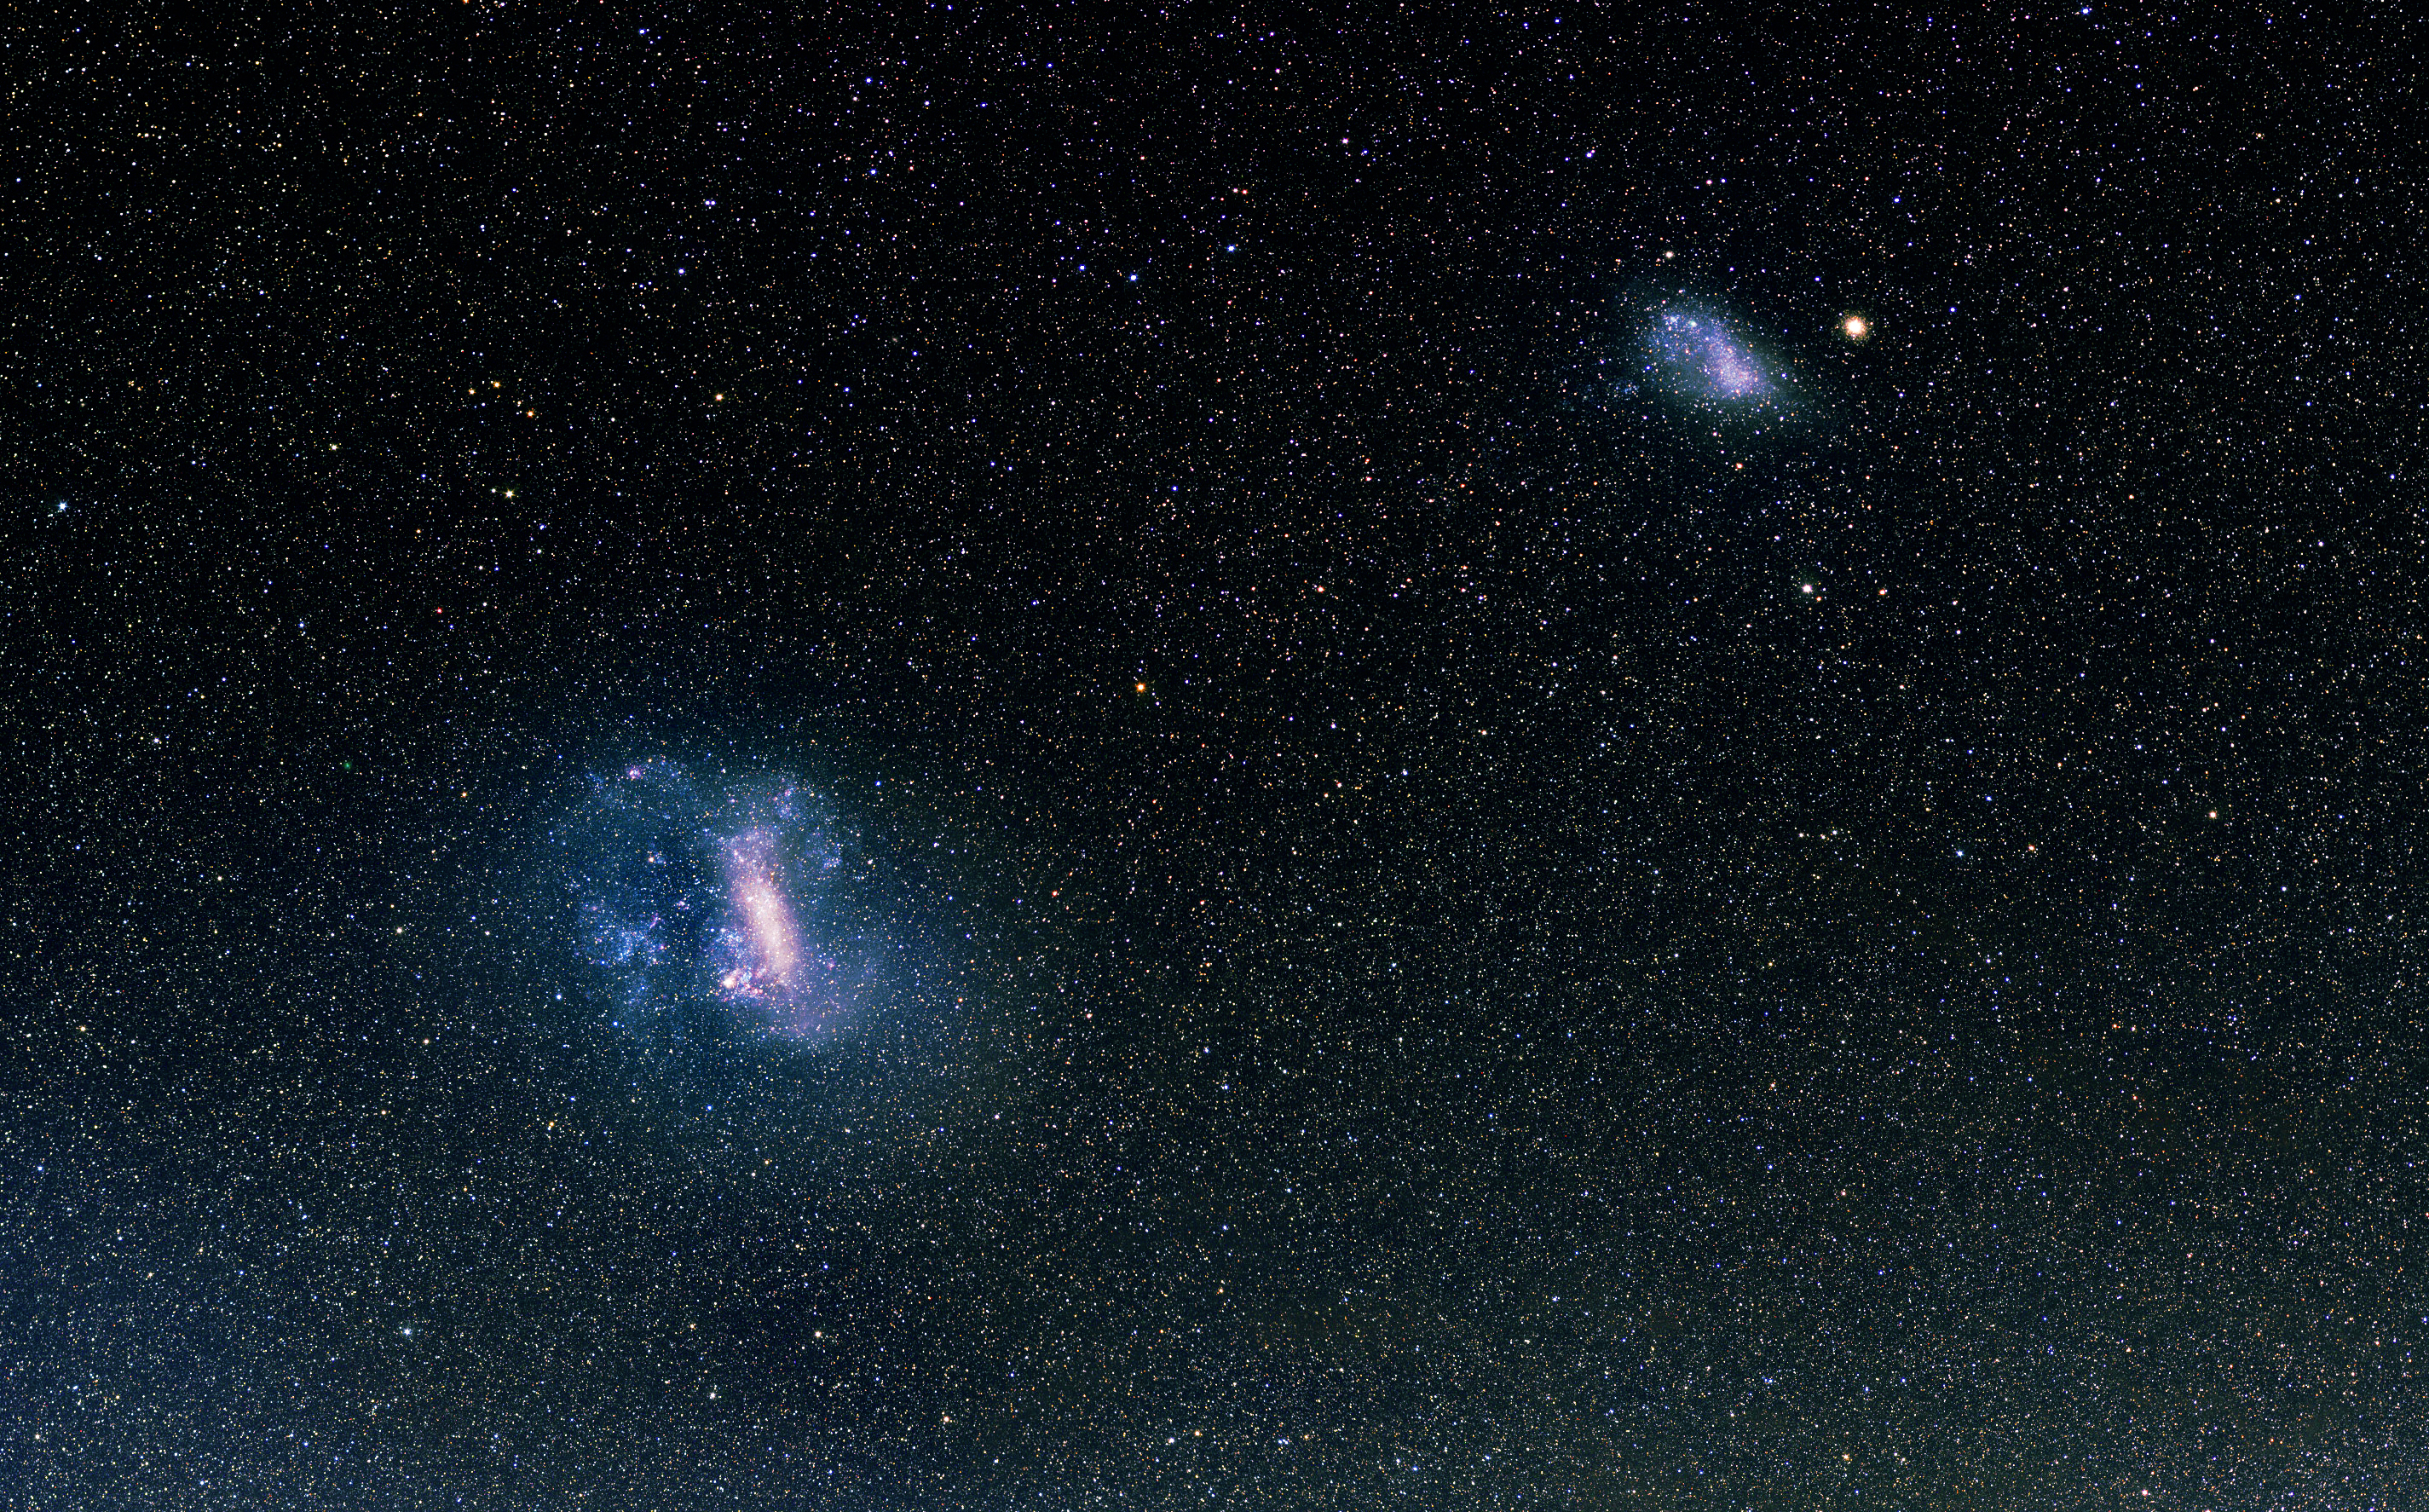
Magellanic Clouds in the night sky
|
|
Credit: Axel Mellinger (CMich, US) V. Belokurov (Cambridge, UK)
|
|
Caption: The Large and the Small Magellanic Clouds are shown in
the orientation similar to the picture above. The Milky Way's center
is towards the bottom right corner. The Clouds are moving towards the
bottom left corner.
|
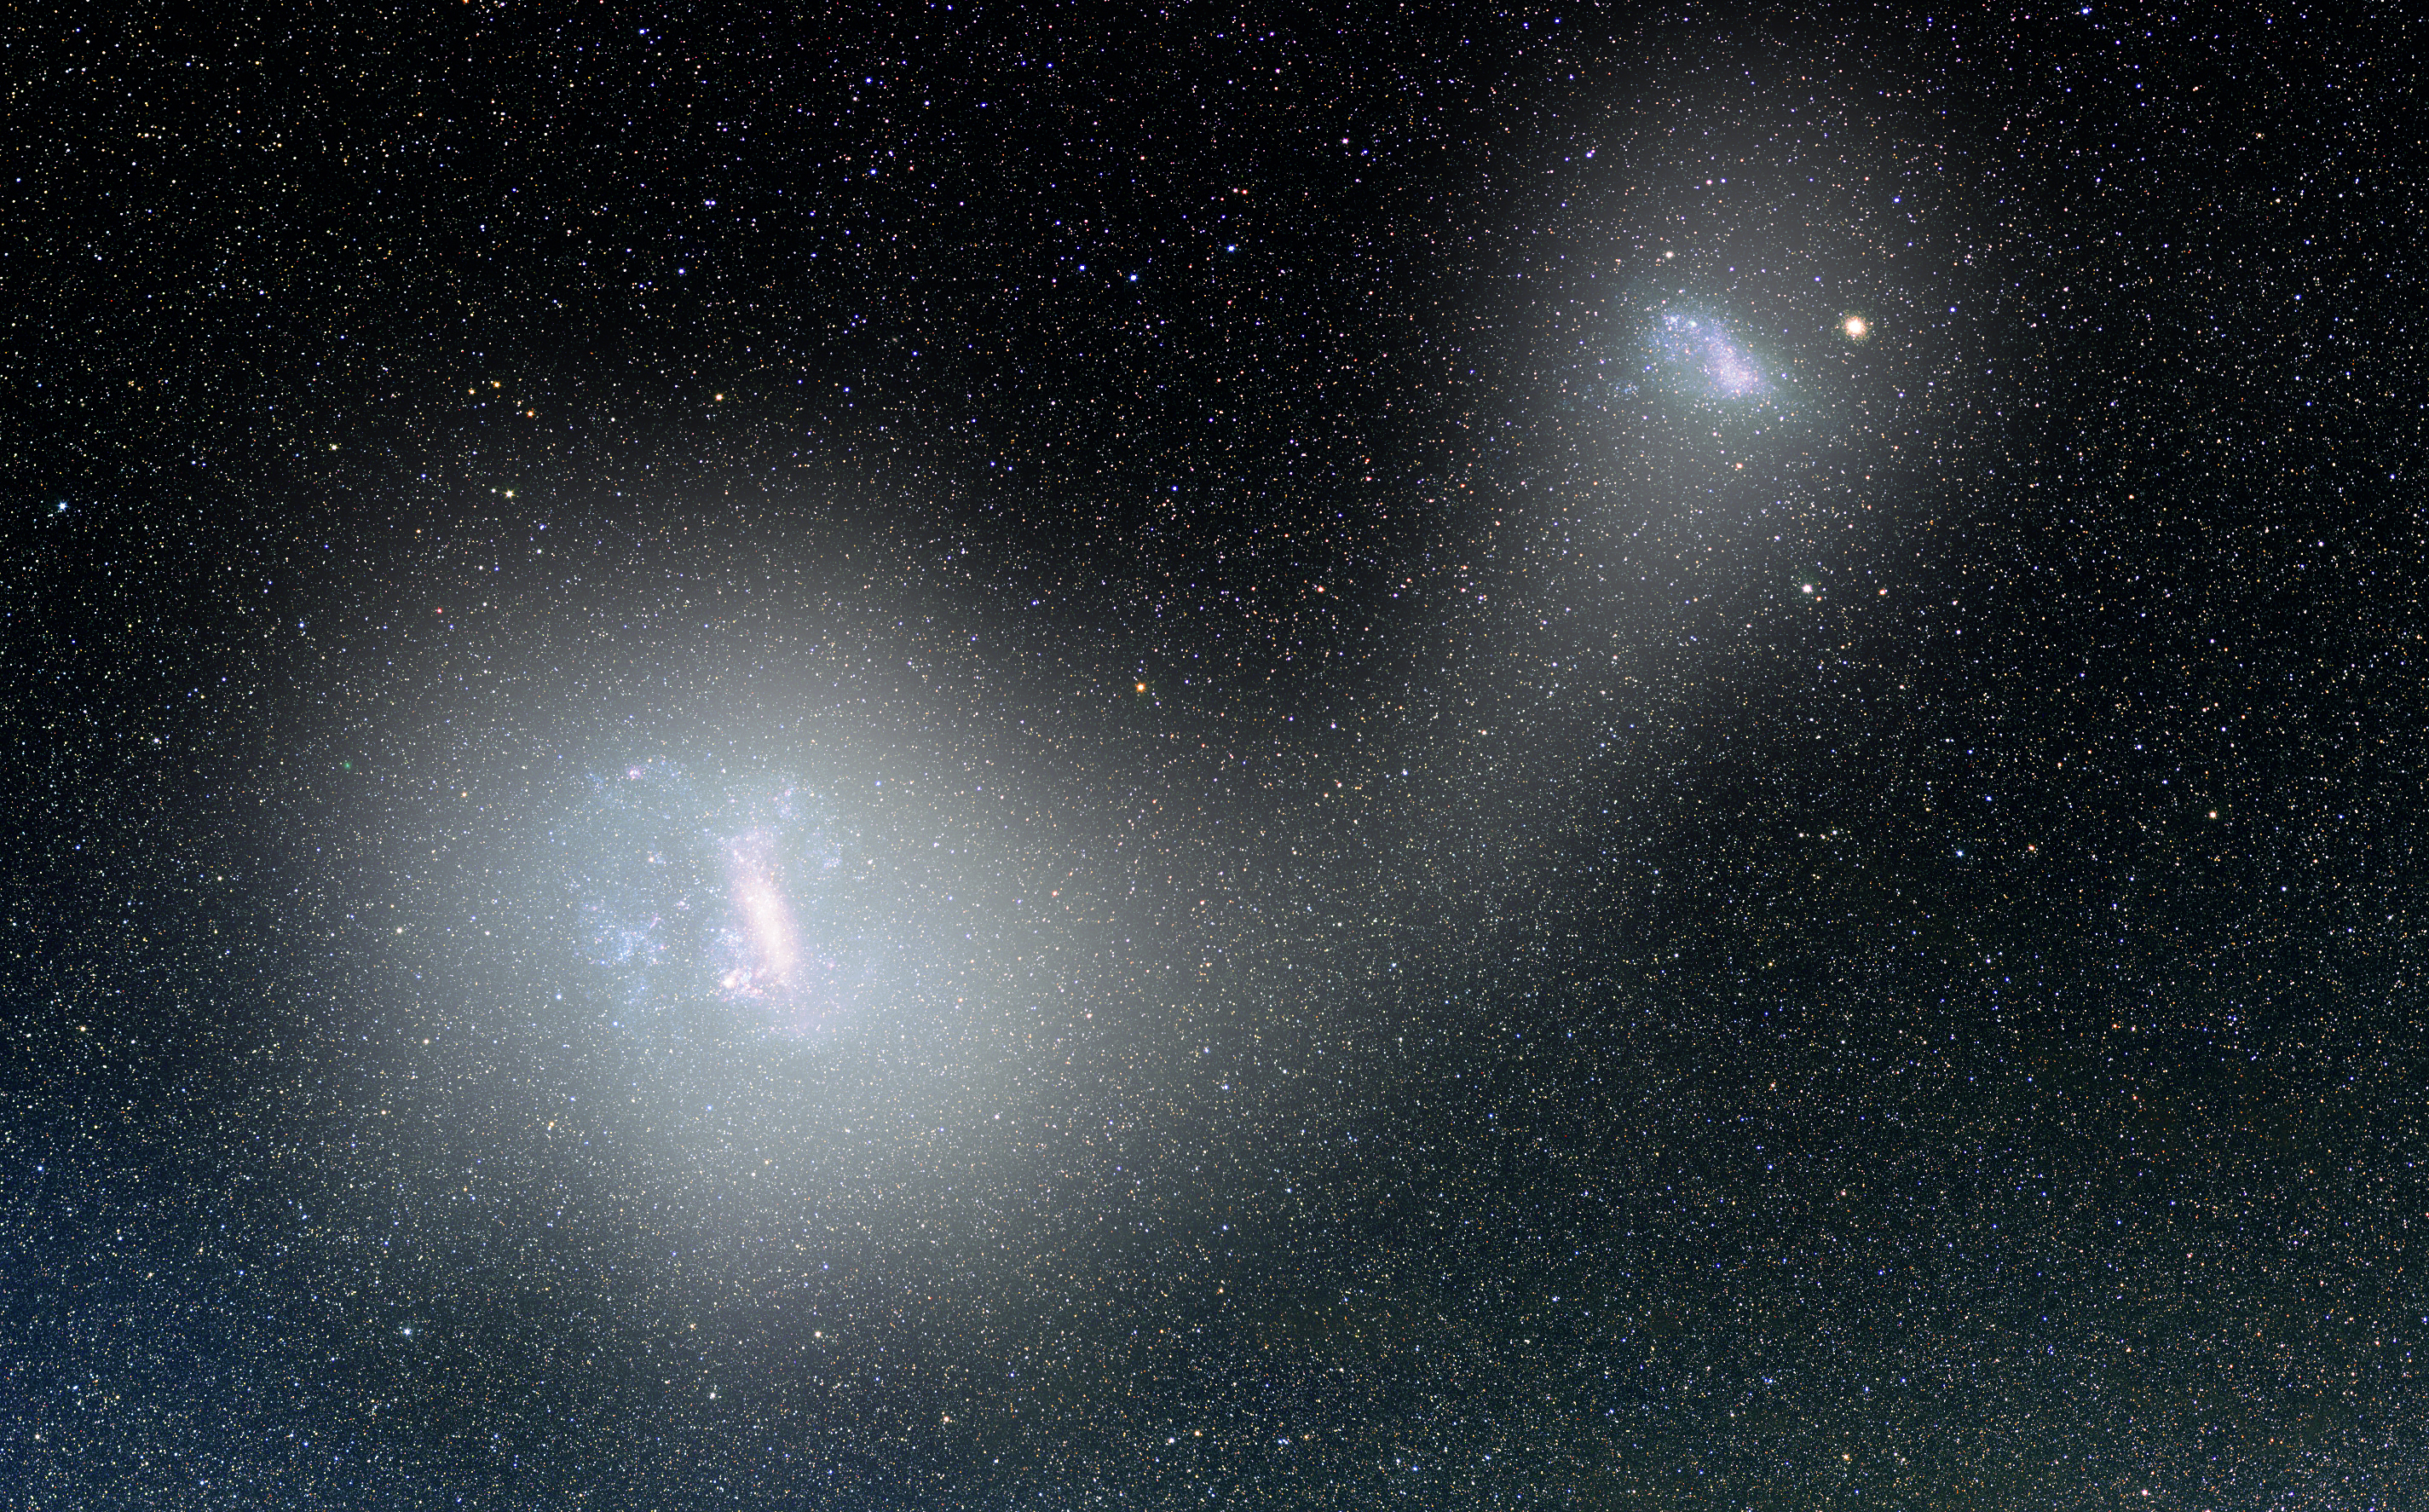
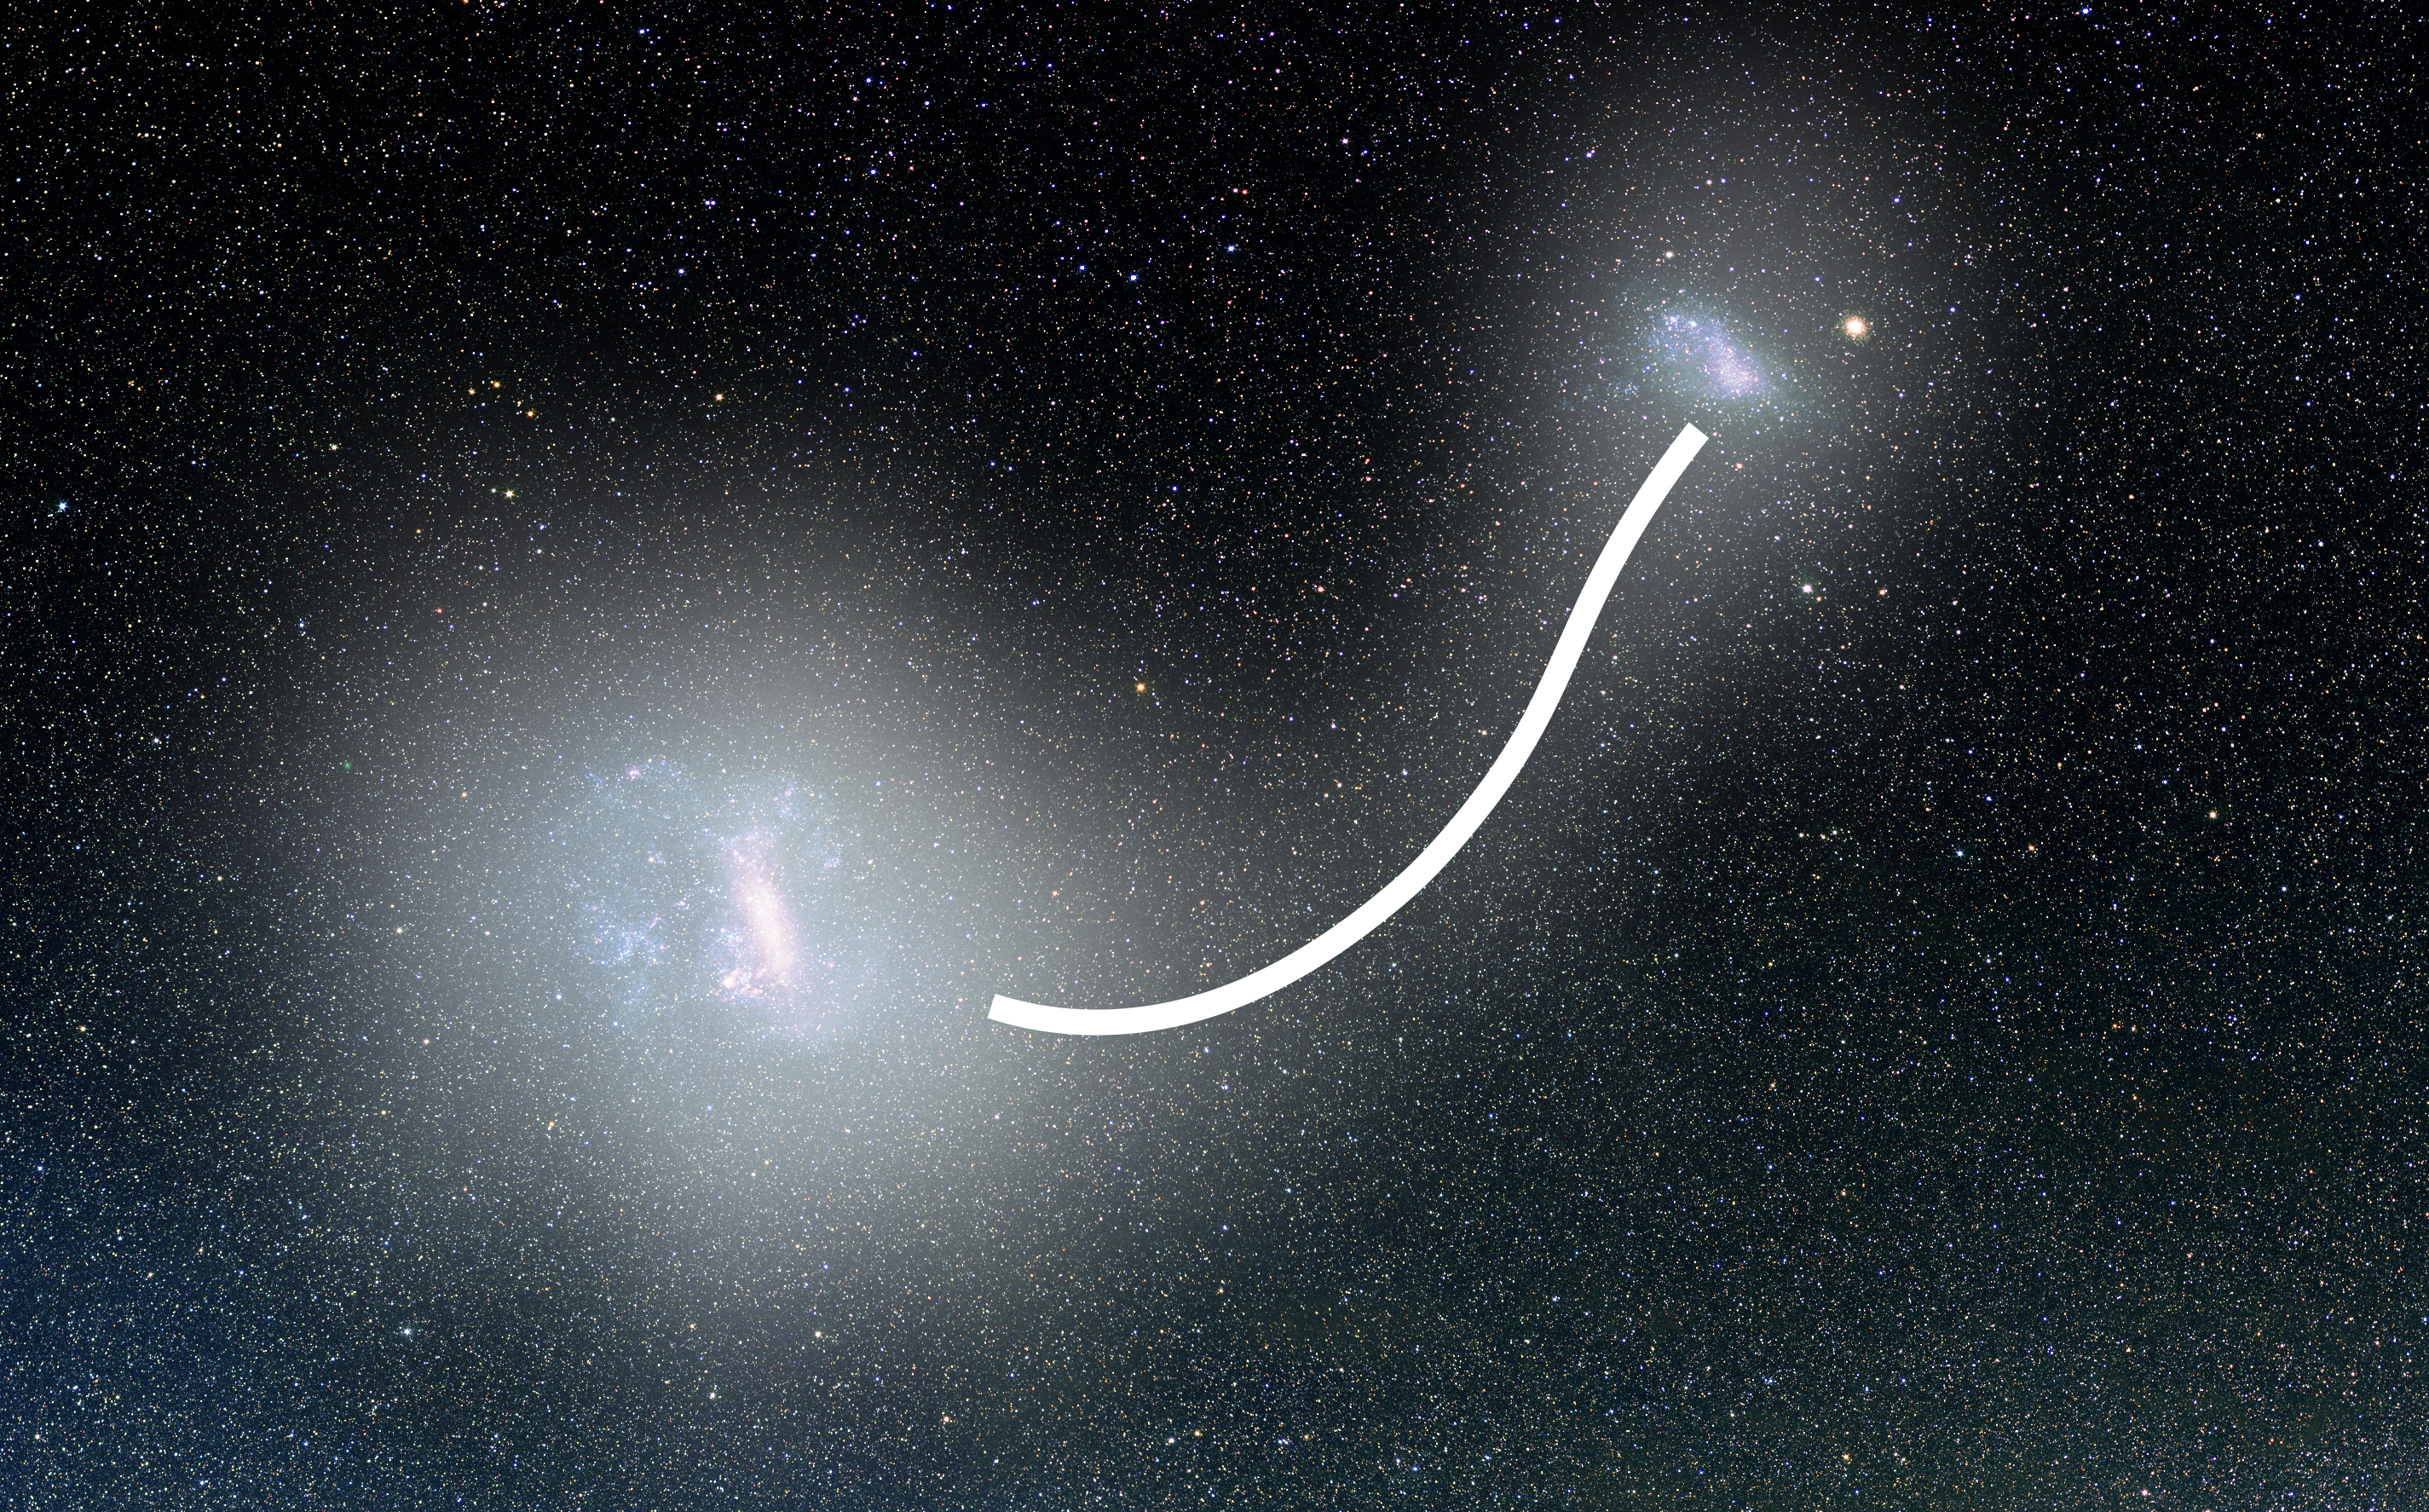
Magellanic Clouds, their stellar halos and the RR Lyrae bridge
|
|
Credit: V. Belokurov, D. Erkal (Cambridge, UK). Photo: Axel Mellinger (CMich, US)
|
|
Caption: Pale white veils and the narrow bridge between the
Clouds represent the distribtuion of the RR Lyrae stars detected with
the data from the Gaia satellite.
|
Magellanic Clouds, their stellar halos and the RR Lyrae bridge
|
|
Credit: V. Belokurov, D. Erkal (Cambridge, UK). Photo: Axel Mellinger (CMich, US)
|
|
Caption: Same as above but with a line shwoing peak density of
RR Lyrae stars along the bridge.
|
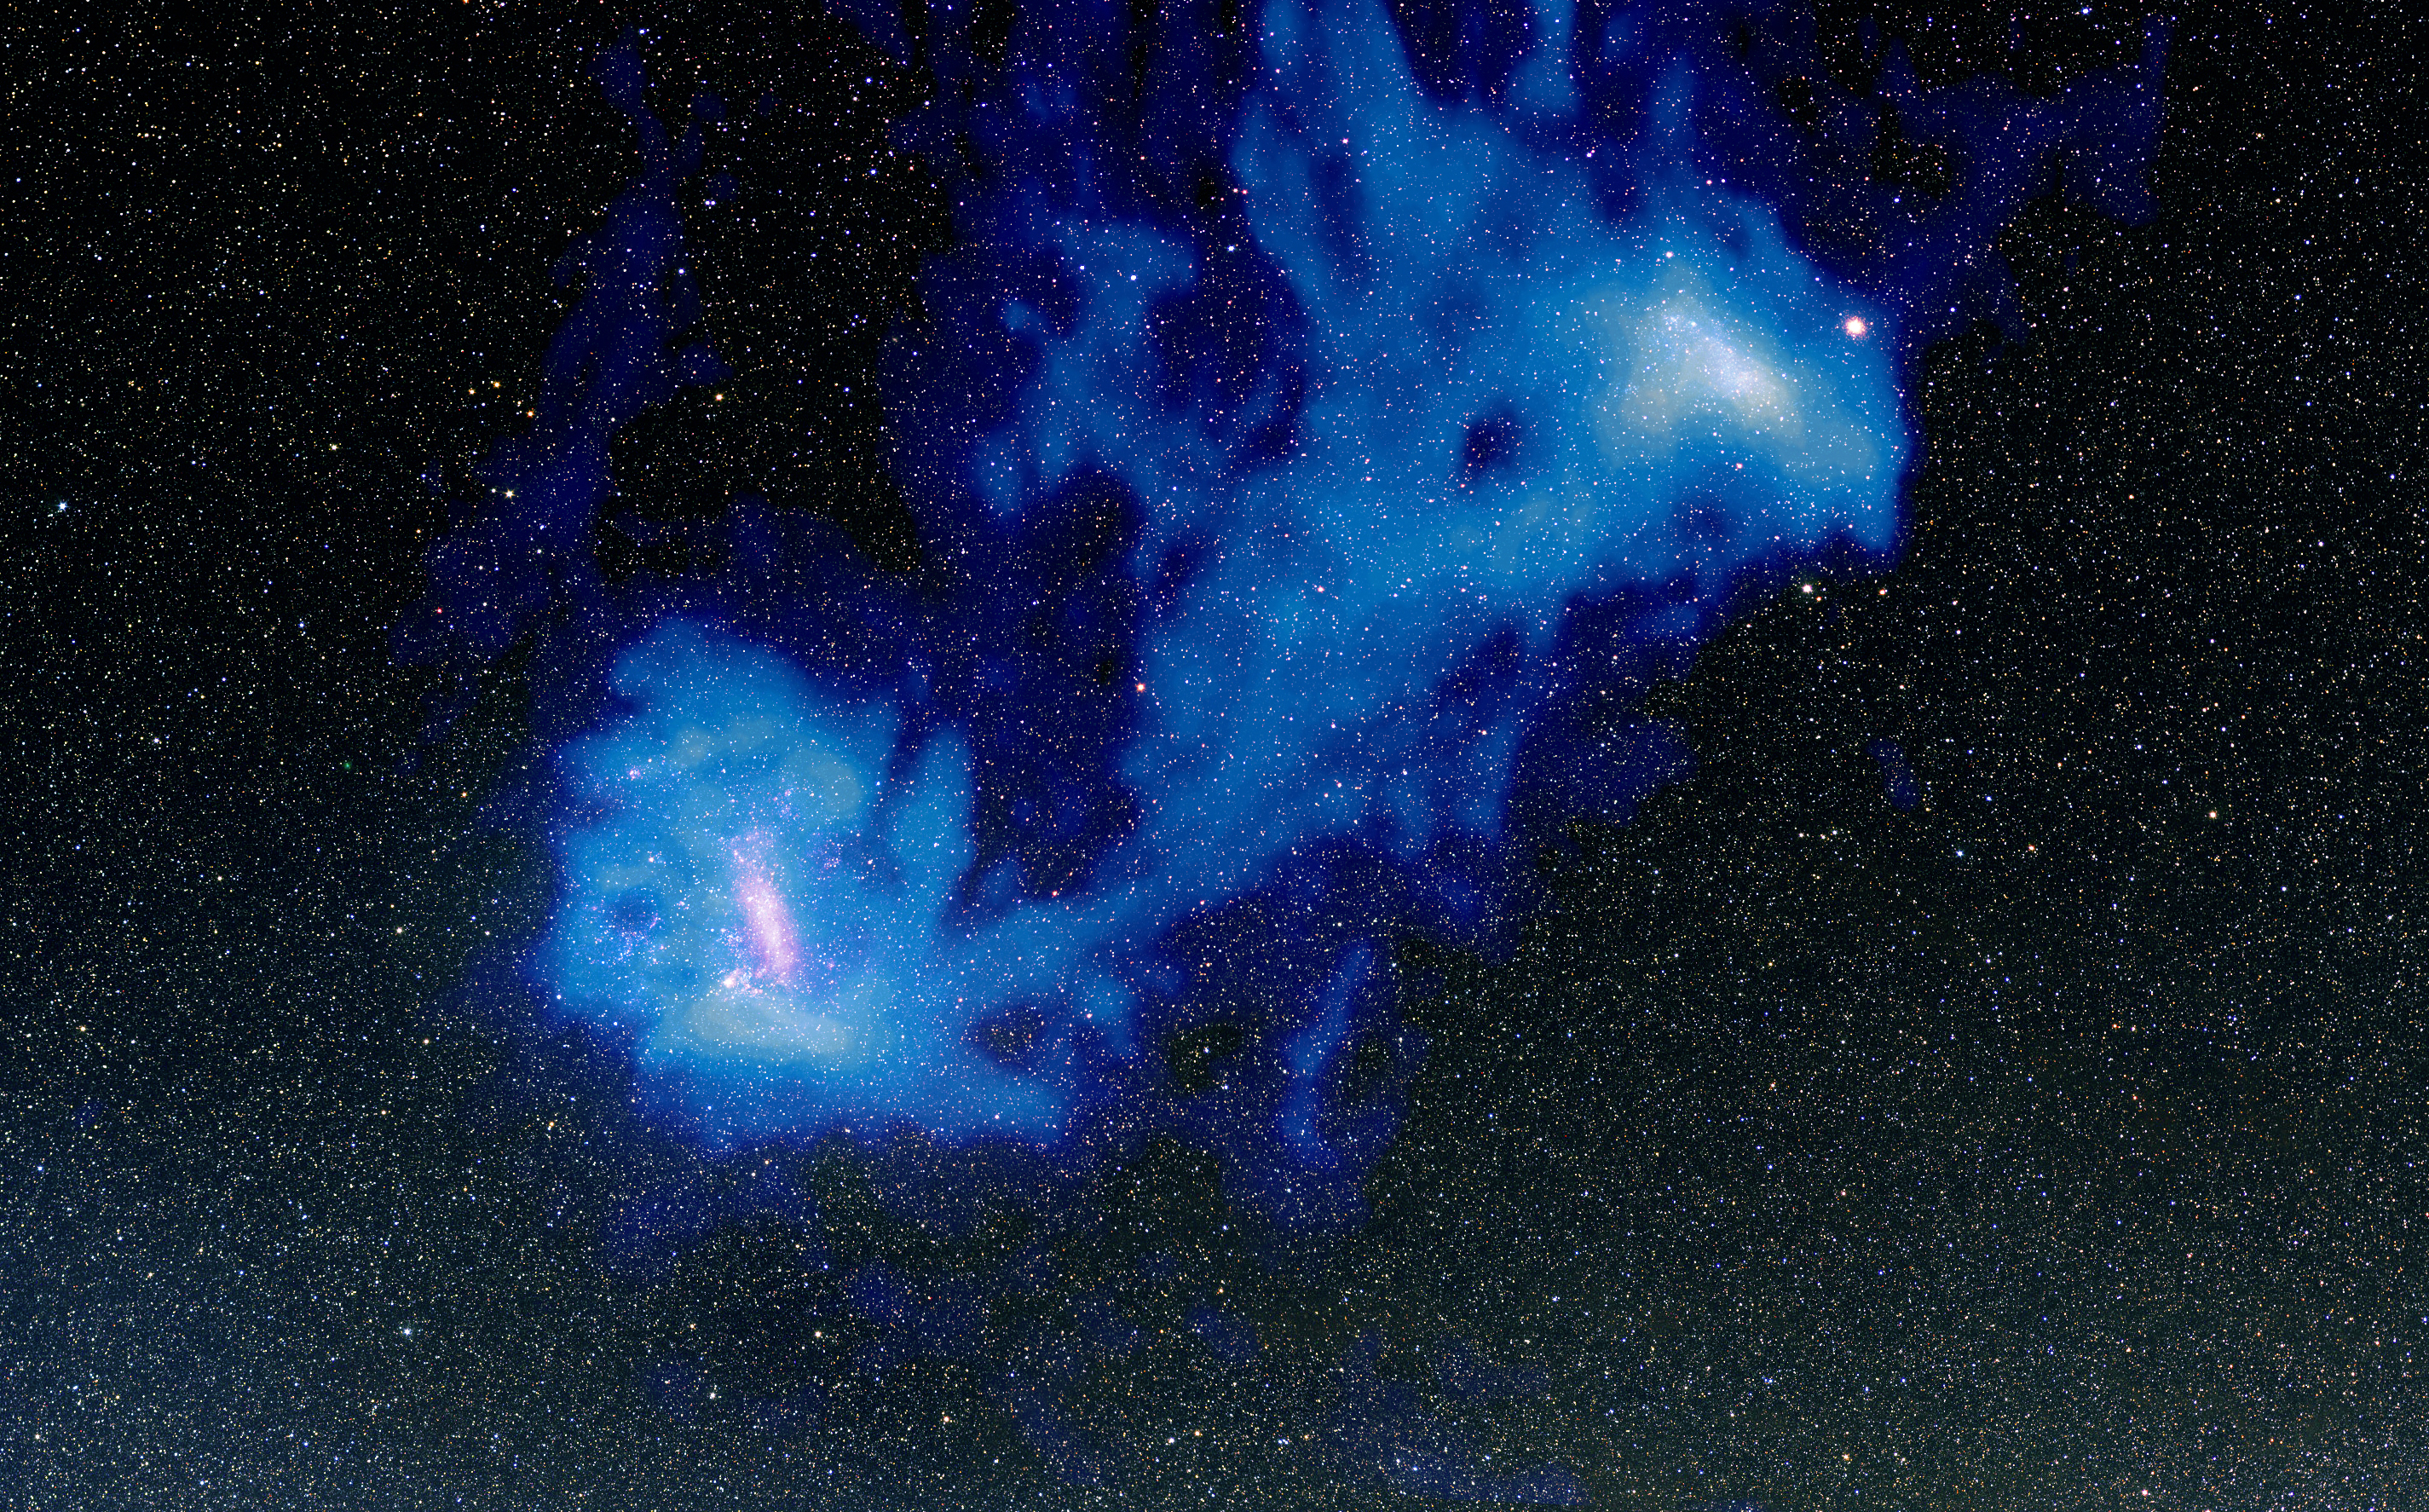
Neutral hydrogen in the Magellanic Clouds
|
|
Credit: V. Belokurov, D. Erkal (Cambridge, UK). HI map:
M. Putman (Columbia, US). MCs photo: Axel Mellinger (CMich, US)
|
|
Caption: Blue fuzz represents the distribution of the HI
gas. You can see that there exists a gaseous bridge conencting the two
Clouds.
|
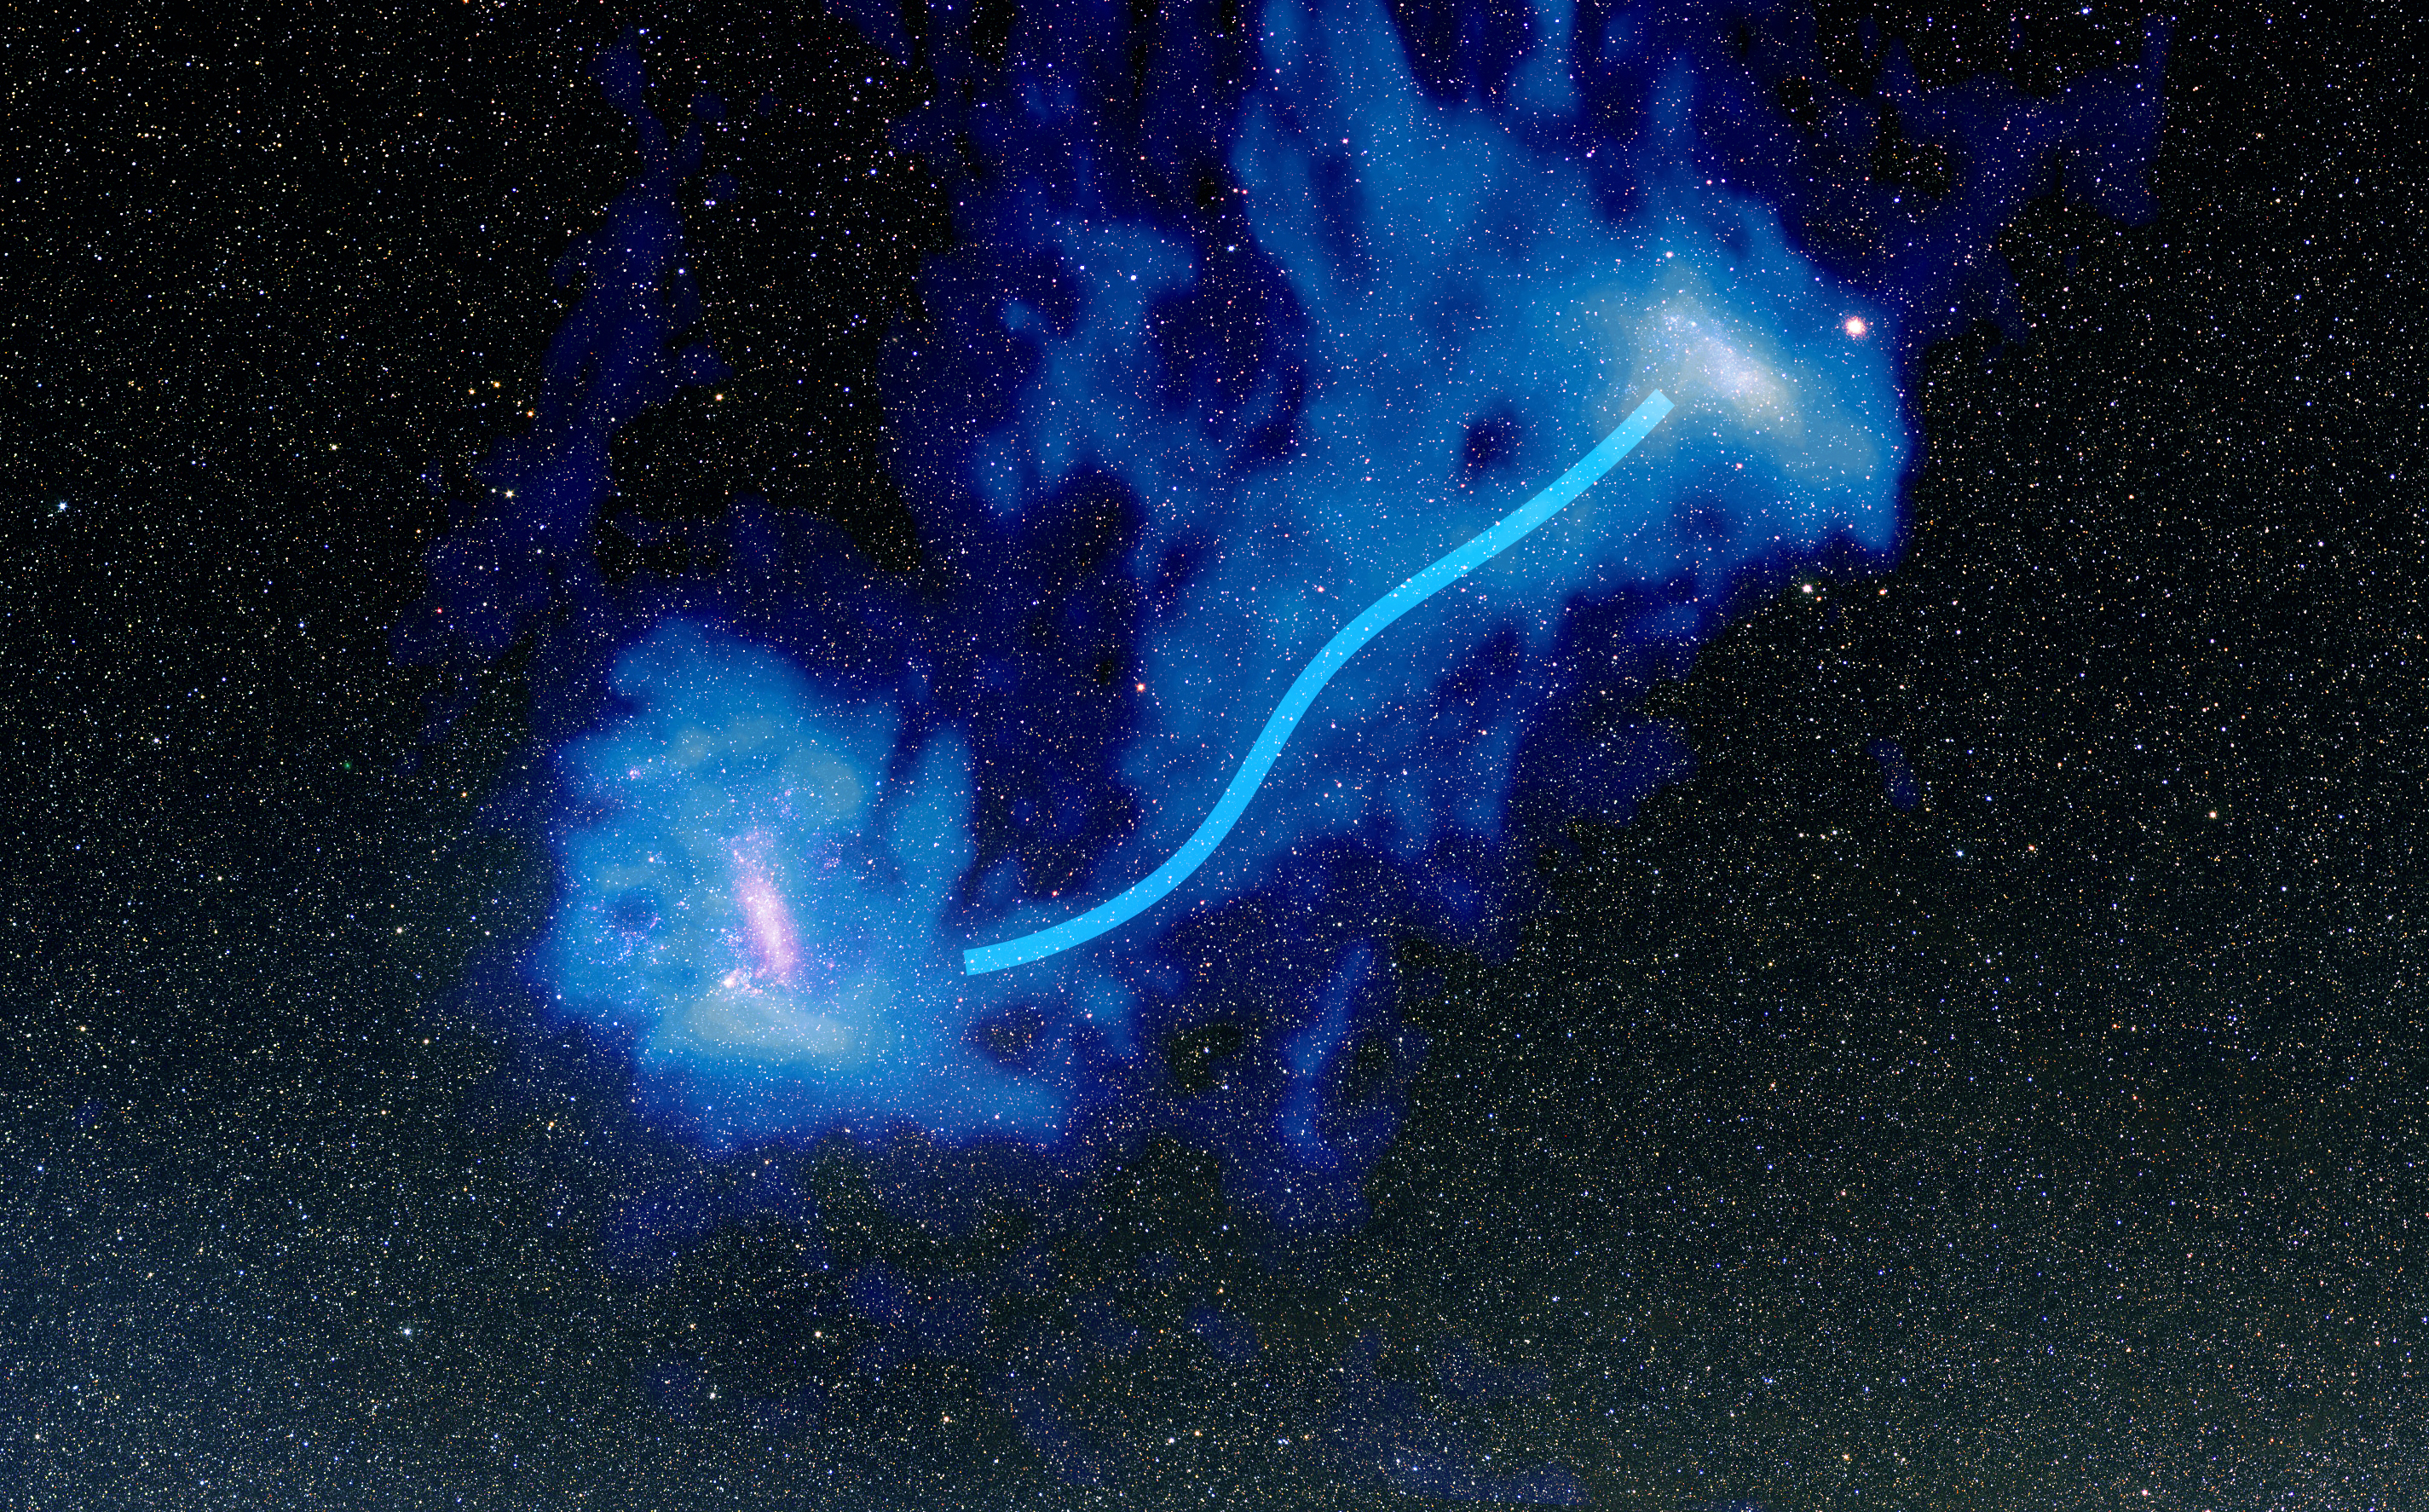
Neutral hydrogen in the Magellanic Clouds
|
|
Credit: V. Belokurov, D. Erkal (Cambridge, UK). HI map:
M. Putman (Columbia, US). MCs photo: Axel Mellinger (CMich, US)
|
|
Caption: Same as above but with a line showing peak density of HI gas in the bridge.
|
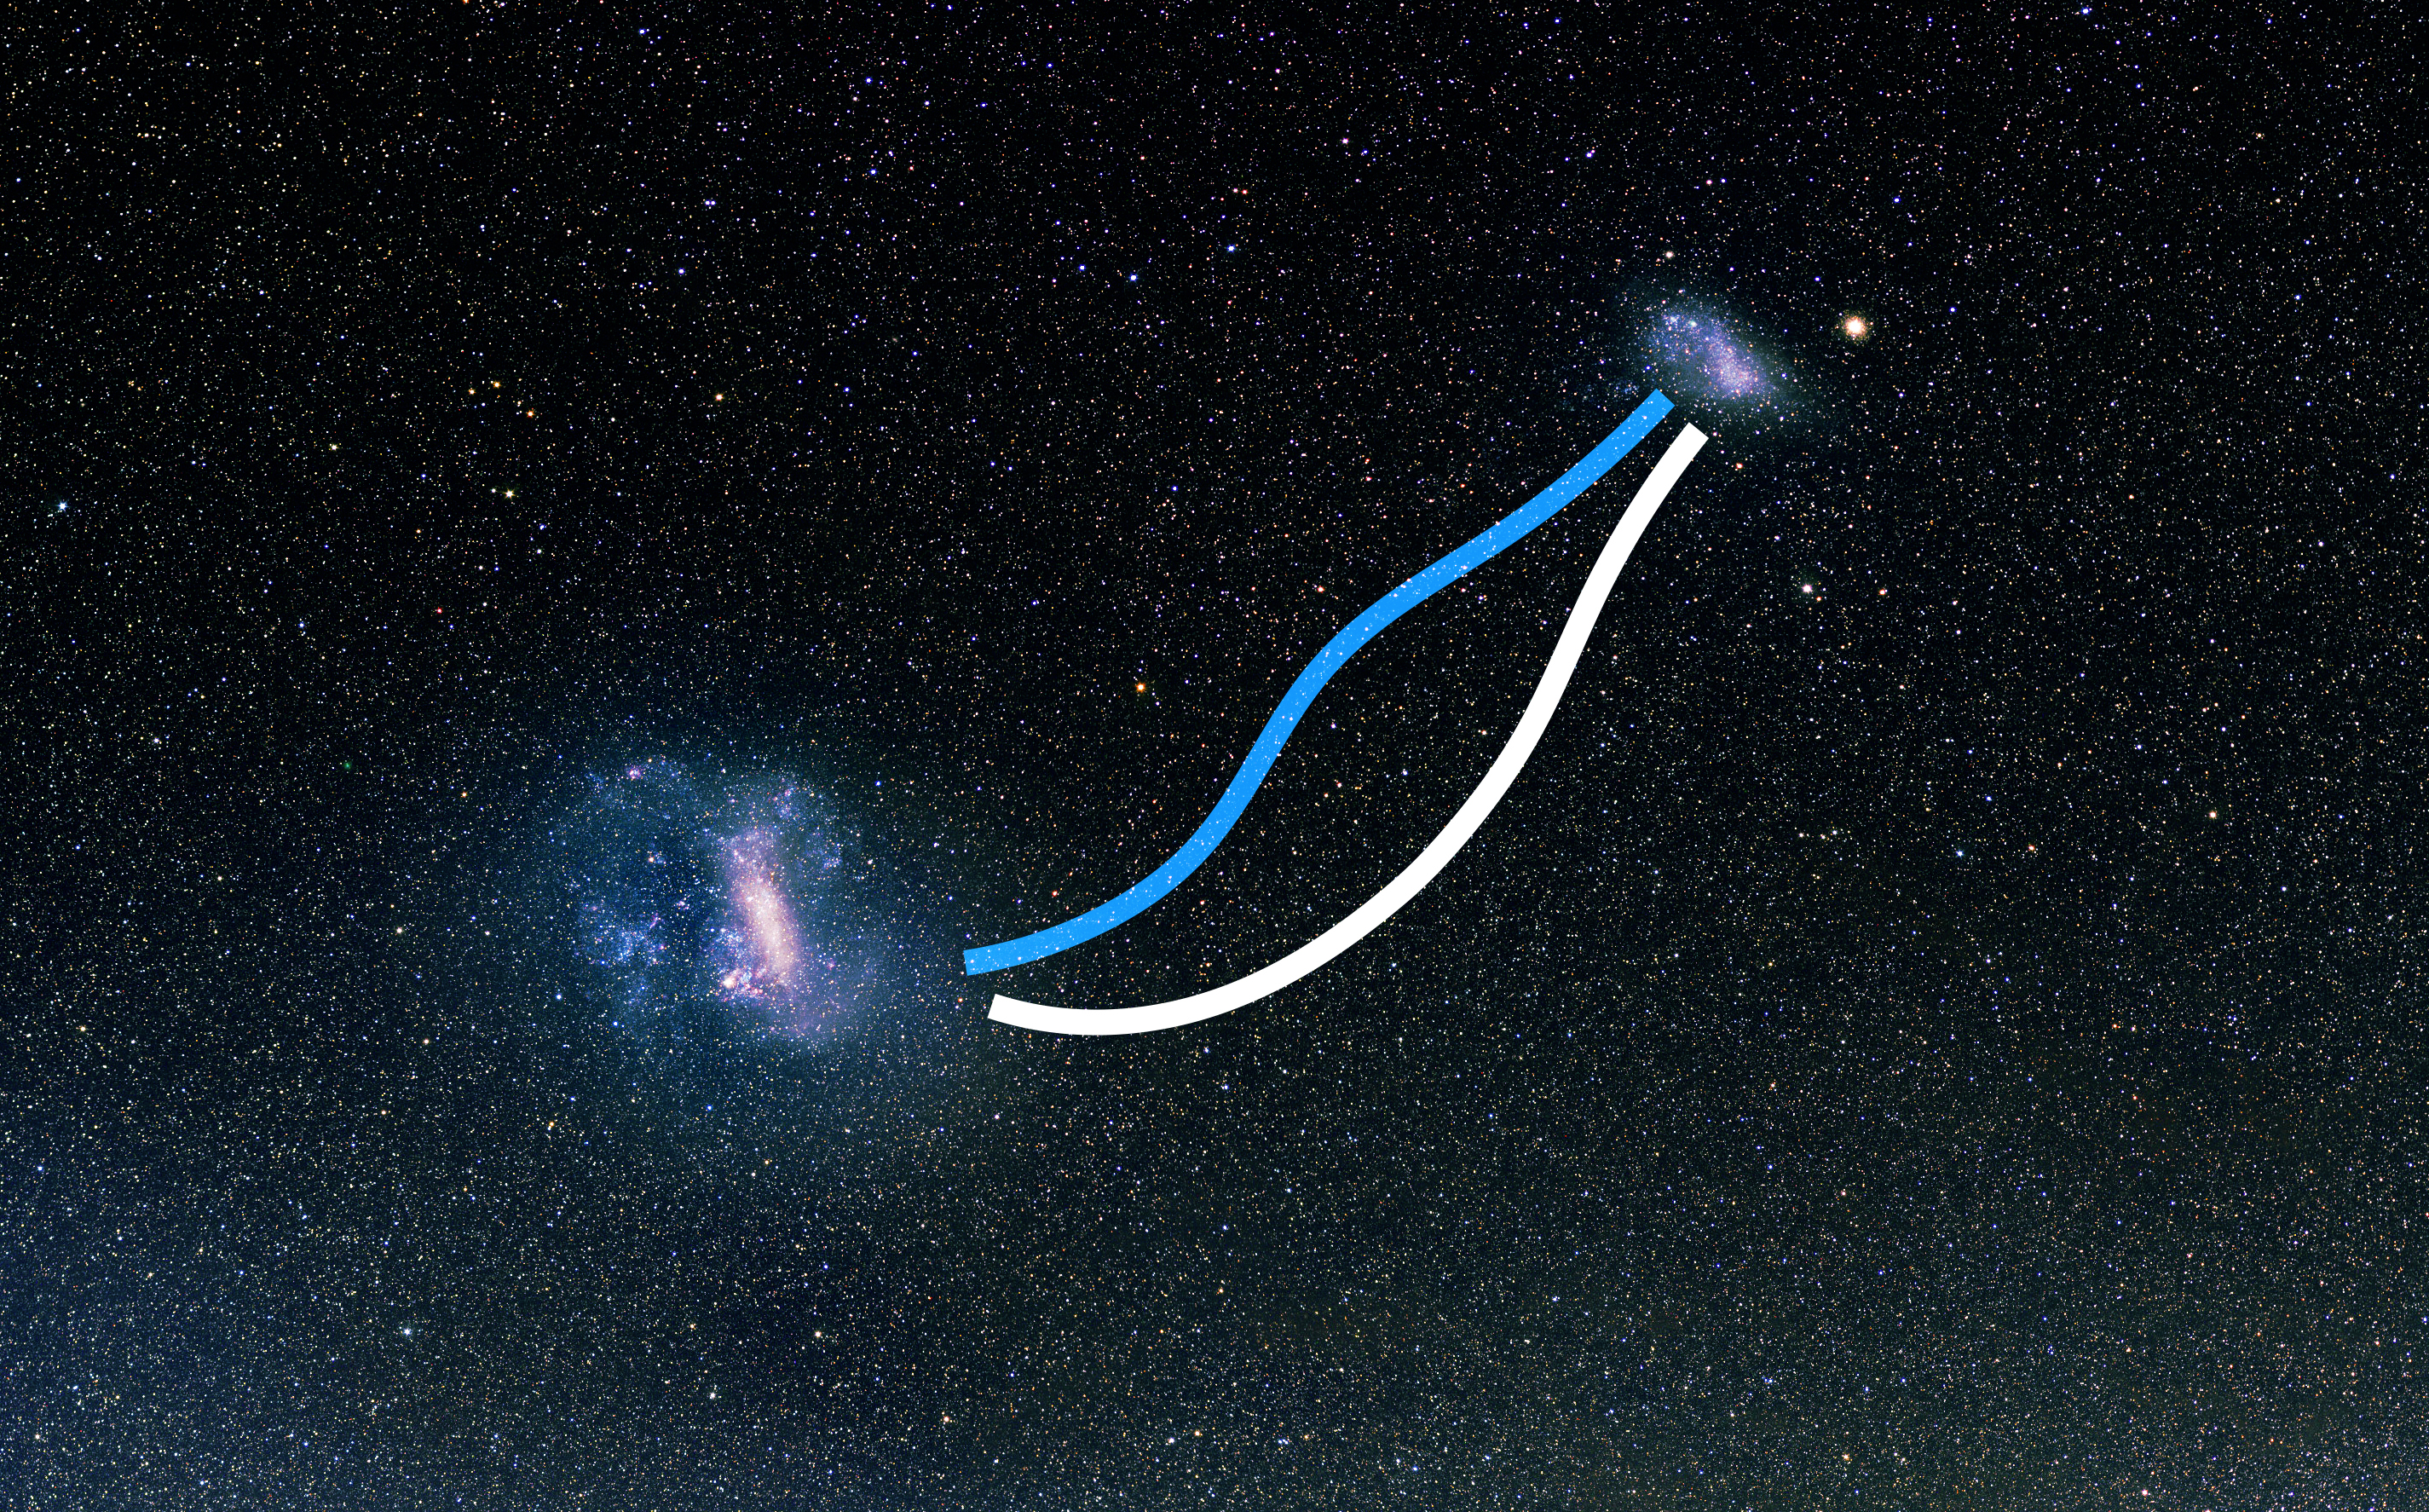
Magellanic Clouds and the paths of the gas and the stars
|
|
Credit: V. Belokurov, D. Erkal (Cambridge, UK). MCs photo: Axel
Mellinger (CMich, US)
|
|
Caption: The white line gives the approximate (average) track
of the stellar bridge and the blue line shows the track of the gaseous
bridge. The stars and the gas do not follow the same path
|
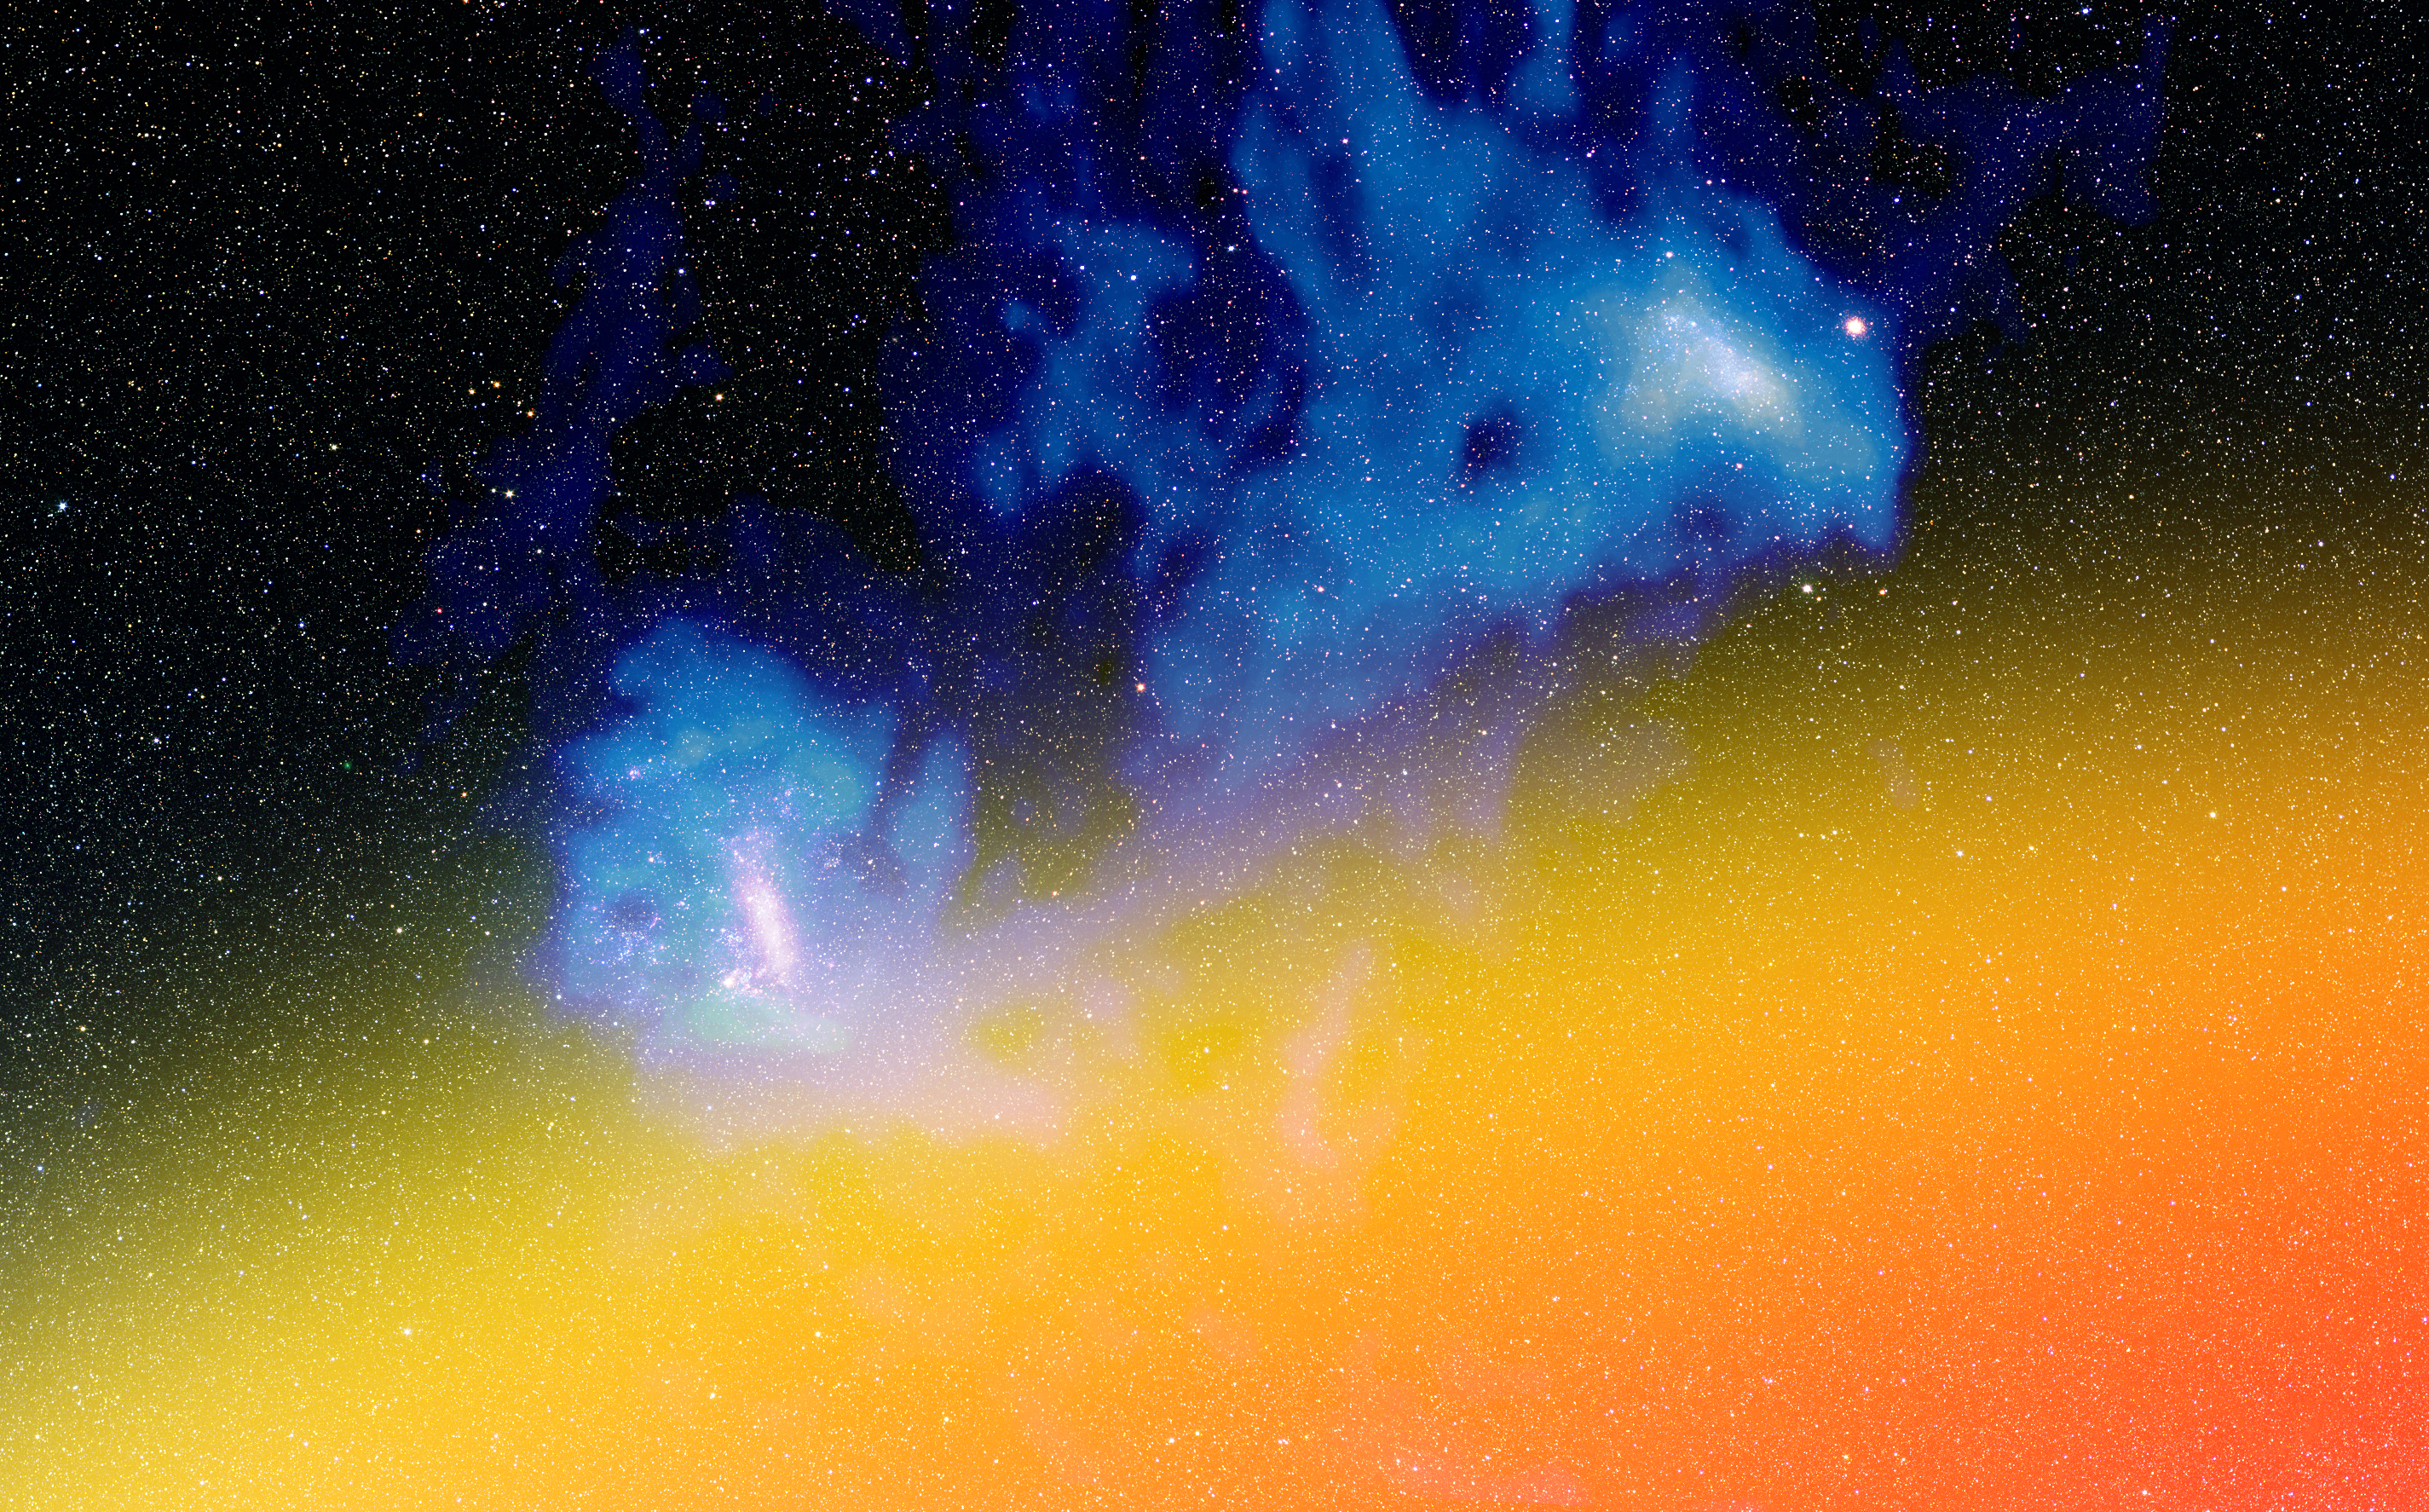
Magellanic Clouds, HI gas the Galactic hot corona
|
|
Credit: V. Belokurov, D. Erkal (Cambridge, UK). HI map:
M. Putman (Columbia, US) MCs photo: Axel Mellinger (CMich, US)
|
|
Caption: The offset between the white and the blue line in the
image above this one may be due to ram pressure exerted by the
Galactic gaseous corona (shown here in orage/red). This drag
(resistance) force acts on both stars and gas, but is more effective
for the gas as it covers much larger volume. If the gas and the stars
started moving at the same time, one can estimate the amplitude of the
force and, therefore, the density of the corona.
|
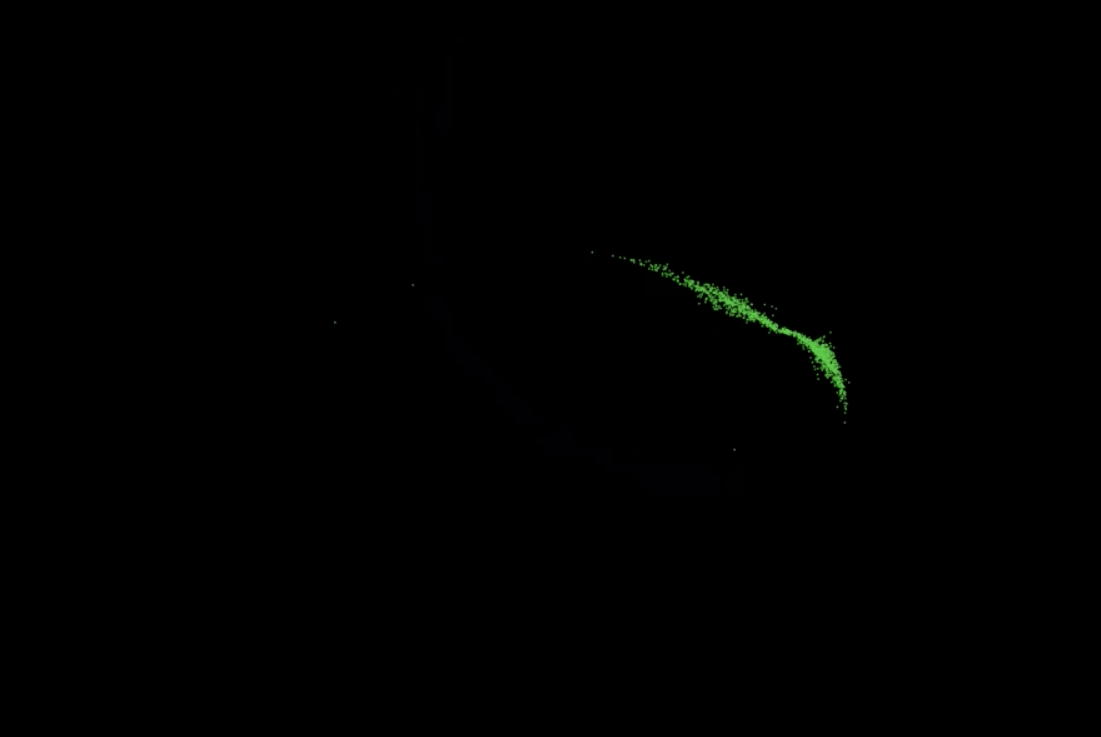
Movie: formation of stellar tidal tails
|
|
Credit: D. Erkal (Cambridge, UK)
|
|
Caption: This animation shows the results of a computer
simulation in which a star cluster disrupts in the gravitaitonl
potential of a galaxy similar to the Milky Way. Two stellar tails form,
one leading the satellite and one trailing behind it.
|
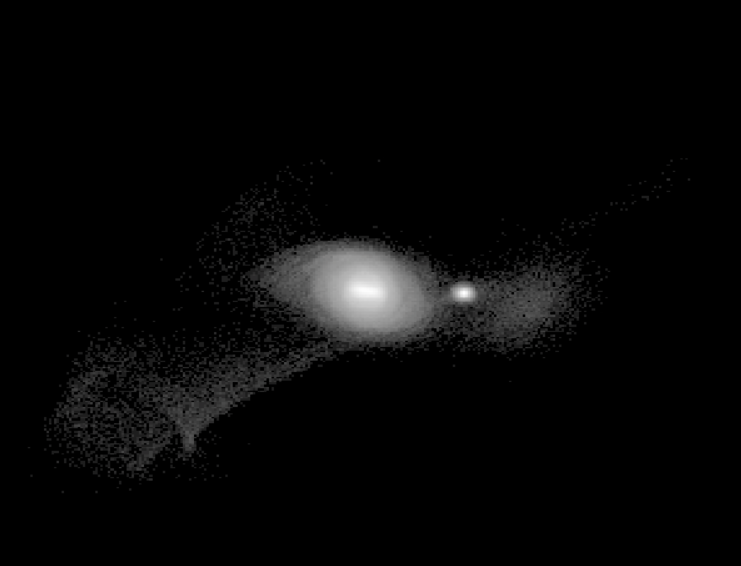
Movie: Disruptiom if the LMC and the SMC
|
|
Credit: D. Erkal (Cambridge, UK)
|
|
Caption: This animation shows the results of a computer
simulation in which the SMC is pulled apart by the LMC (and the
MW). You can also see the affects of the Milky Way on both the LMC and
the SMC stellar debris.
|