Measure detector properties, summary:
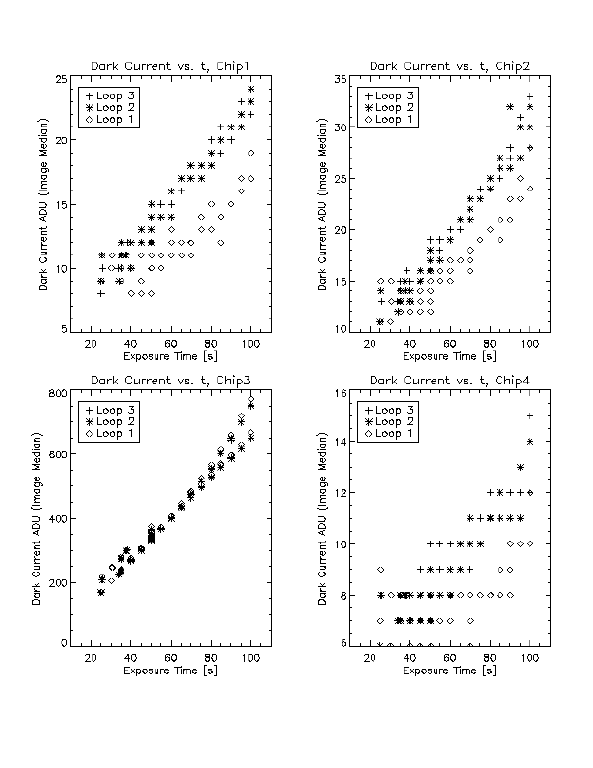
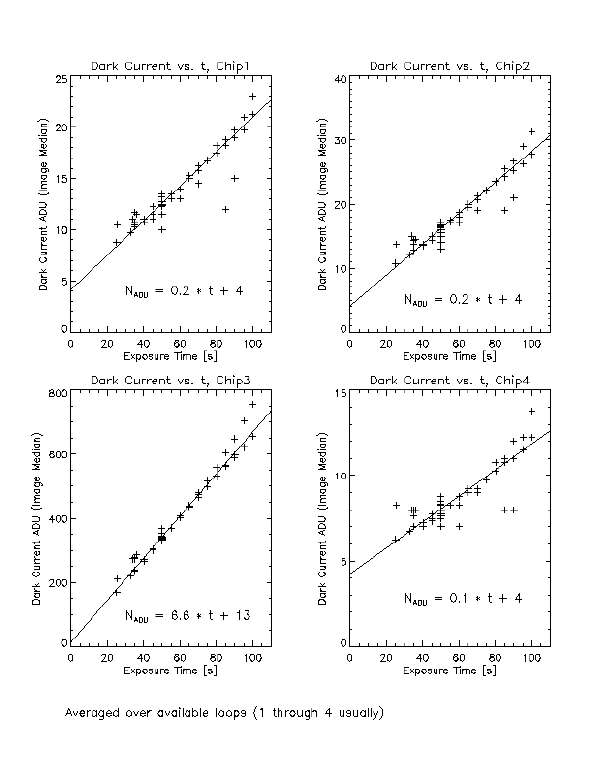
The dark current is about 10 ADU in 45 second exposure, except for chip 3
with 340 ADU in 45 second exposure.  Loop 1 has sytematically lower dark
current by about 25%.  Dark current is linear with time for relatively
short exposures.

Read noise of about 3.7 ADU.

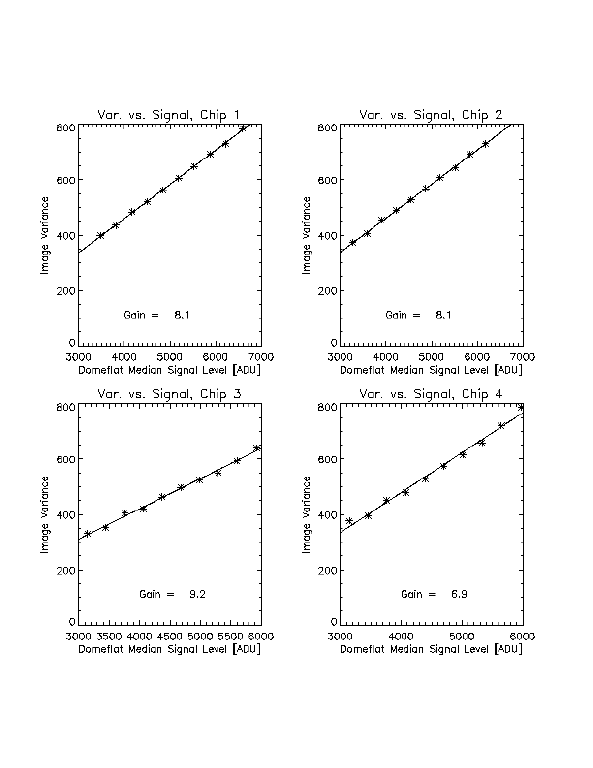
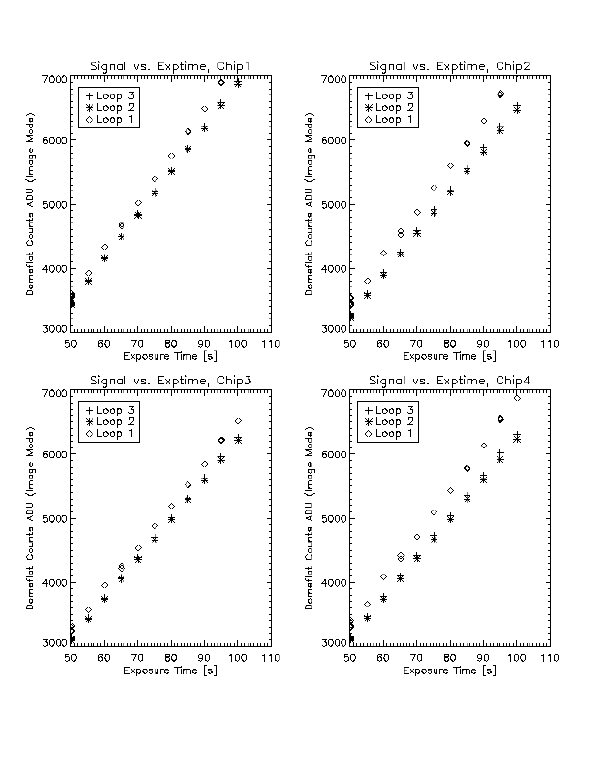
The measured gain from the variance vs. signal plot is about 8 e/ADU,
compared to 10.1 in the FITS headers.  It seems the gain is different
for loop 1 compared to the other loops.  The signal level in loop 1
domeflats is about 5 or 10% higher than other loops.

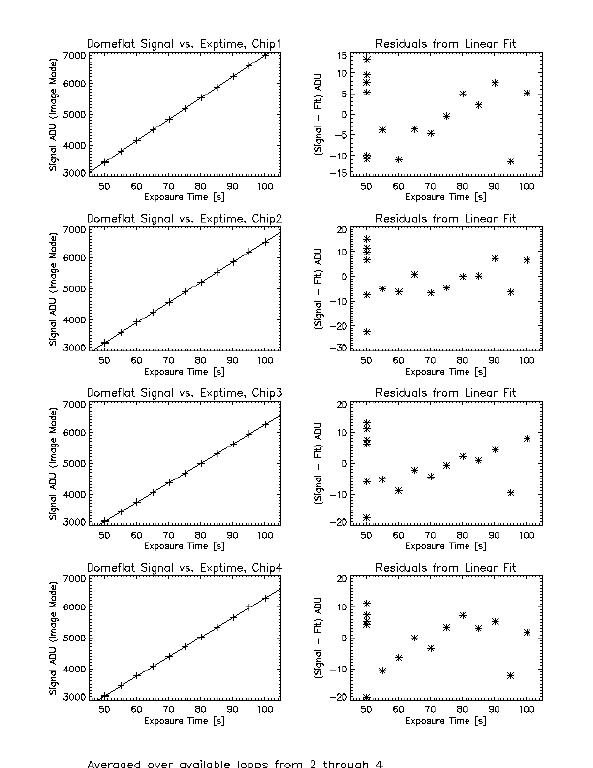
The average response of the detectors in the range of about 3000 to
7000 ADU appears to be linear to better than 1%.
Measure dark current and read noise
Data: 25 December 1999, Runs 10503 to 10555 (45 and 90 second dark frames)

Analysis: Calculate mean and sigma images over all runs for each loop and
          each chip.  Take median of mean and sigma images to get dark
          current and read noise.


                Dark current (ADU) in 45 second exposures

        Loop 1          Loop 2          Loop 3          Loop 4

Chip 1    9.5            12.6            13.0            13.1

Chip 2   15.3            16.9            17.2            17.4

Chip 3  344.8           336.1           336.0           338.5

Chip 4    6.9             7.5             7.9             8.1


                Read noise RMS (ADU) (in 45 second exposures)

        Loop 1          Loop 2          Loop 3          Loop 4

Chip 1   3.8             3.8             3.7             3.7

Chip 2   4.3             3.8             3.7             3.6

Chip 3  11.5            10.4            10.4            10.5

Chip 4   3.9             3.7             3.7             3.6


                Dark current (ADU) in 90 second exposure

        Loop 1          Loop 2          Loop 3

Chip 1   16.8            22.7            22.2

Chip 2   26.1            30.8            30.8

Chip 3  699.3           680.3           682.1

Chip 4    9.5            12.4            12.3


                Read noise RMS (ADU) (in 90 second exposure)

        Loop 1          Loop 2          Loop 3

Chip 1   3.8             3.7             3.7

Chip 2   3.7             3.7             3.6

Chip 3  10.3             7.1             7.1

Chip 4   3.6             3.6             3.6
Measure Gain
Measure Non-linearity
The average response of the detectors in the range of about 3000 to
7000 ADU appears to be linear to better than 1%.
