Images are saved as a sequence or as a single image in either .APF, .OPF, 8-bit TIFF, 16-bit TIFF, FITS, DIB, Prisma, Imager2, Spectacle or Grams file formats. Once a sequence has been loaded from disk or grabbed by the camera, one image from the sequence is displayed in the main window.
The image can be controlled using brightness/contrast control, lookup tables and analysed by zooming into and out of a particular area, or viewed as a statistical evaluation, plot, histogram, or as pixel values. There are several ways of controlling how each grey level of the image acquired is displayed on your monitor. The image acquired can have over a million grey levels but the display has only 256 colours or grey levels.
The following parameters allow you to adjust the display of your data to allow you to see the details you want without affecting the actual data.
Select the Image view from the View menu or use the Image icon on the view and navigation toolbar. The image can be accessed for viewing at any time throughout the use of the PixCel software by this method. For images larger than the display window, use the window scrollbars located at the bottom and right hand side of the image and to pan and scroll within the image. These are not available on images that fit inside the display area. The Status bar shows current cursor position and pixel intensity.

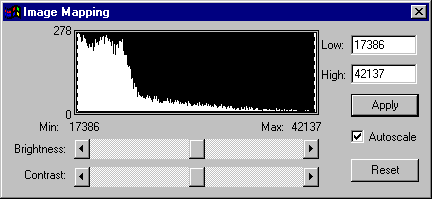
Select Mapping from the View menu or use the Mapping icon on the main control toolbar to display the image mapping dialogue. This function is only available in Image View.
The slide controls alter the brightness and contrast. Drag the button and you will notice the changes in the histogram above and the pixel numbers changing in the low and high boxes. Gradual changes can be made by clicking on the left and right arrow buttons. Again changes can be seen in the low and high boxes. Alternatively, figures can be entered into the low and high boxes.
Within the brightness/contrast window the dotted vertical lines representing the maximum and minimum display grey levels can be picked up by pressing and holding the left hand mouse button and moving the required distance. The changes in figures appear in the low and high boxes and appropriate adjustment is made to the slide controls.
Click on the Apply button to apply the changes or the Reset button to cancel the changes made and revert to the previous parameters.
Click on Autoscale to set the maximum and minimum display values automatically. Sometimes the automatically selected values do not give you the best display of your image. If this is the case, you can select the grey level distribution which best matches your image. Click OK to accept the changes or Cancel to abandon the changes and revert to the Mapping dialogue box.
To close the Mapping dialogue box and return to the main window click on the X button in the top right hand corner of the box.
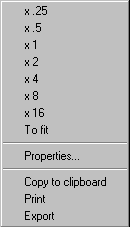
Click the right hand mouse button to access the Zoom in/out menu.
To return to the original image format click the right hand mouse button and choose x1 from the Zoom in/out menu. CLick outsode of the option box to close it and return to the main window.
Use the Shift key together with dragging the mouse to select the area to fill the main window (zoom in). This defines the rectangle selection for plots and histograms as well.
use the Ctrl key together with dragging the mouse to select an area that the main window should fit into (zoom out). This defines the rectangle selection for plots and histograms etc.
The Properties dialogue box contains details of the image. Copy to clipboard, Print and Export short cut options are also available from this option box.
![]()
Use the First/Last/Next/Previous/Frame #/Play and Stop buttons on the view and navigation toolbar to move from one image to another in the sequence. Alternatively, enter the frame number in the Frame # white box if a particular frame is required. Press the play button to play a movie of all the images in a sequence.
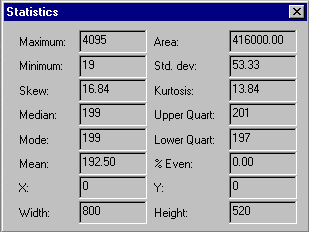
This feature provides information about the image defined by the current rectangle selection i.e. Maximum, Area, Minimum, Std dev, Skew, Kurtosis, Median, Upper Quartile, Mode, Lower Quartile, Mean, % Even, X, Y, Width, and Height.
Select the Statistics icon to access the Statistics dialogue box. Alternatively select View/Statistics from the main menu.
To close the Statistics dialogue box and return to the main window click on the exit button in the top right hand corner of the box.
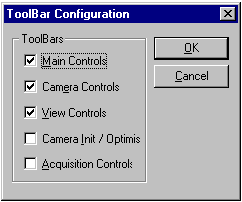
Select the Toolbars icon to access the Toolbar configuration dialogue box. Individually clicking in the check boxes to select the Main, Camera, View, Camera Init/Optimise and Acquisition Controls will enable or disable the display of the toolbars and control boxes on the screen.
Click on OK to accept the changes or Cancel to abandon the changes made or the X button in the top right hand corner of the dialogue box to close the toolbar dialogue box and return to the main image window. Default settings are Main Controls, Camera Controls and View Controls. To review the toolbars, select View from the main menu, select Toolbars and reselect the options available. This feature is available in all views.
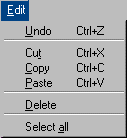
Use the Edit/Copy option from the menu, Ctrl+C, or the Copy icon to copy the rectangle selection to the clipboard. The information copied depends on which view is selected.
This selection can be pasted into another package e.g.Word or Excel.
The Copy function is also available by clicking the right hand mouse button in the image and selecting Copy to Clipboard from the Zoom in/out option box.
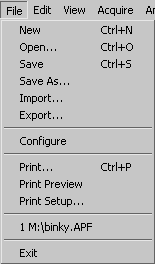
Select File/Print from the menu, Ctrl+P to access the Print dialogue box
This will allow the selection of desired printer, print properties, print range and quantity of copies. Click on OK to accept the changes or Cancel to abandon the changes.
Alternatively, click on the Print icon to print the rectangular selection of the image.
The image can be previewed before printing by using the Print Preview menu option in the File main menu. The page can also be changed from landscape to portrait, letter to A4 etc. using the Page Setup option from the same menu.
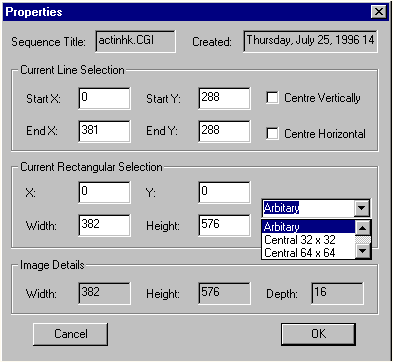
The Properties dialogue box provides details about the name of the sequence, the date it was created, pixel locations of the line selection and rectangle selection, together with the image width, height and depth.
The Properties dialogue box is activated by clicking with the right mouse button in the main image window and selecting Properties from the Zoom in/out options box.
The current line and rectangle selection parameters can be edited by entering information in the white boxes. The current line selection can be centred horizontally or vertically by clicking in the appropriate box.
A pull down menu in the Current Rectangle Selection area of the properties box allows you to set some useful regions quickly, such as the central 64 x 64 pixels of the image.
Click on OK to accept the changes or Cancel to abandon the changes and revert to the main window.
Alternatively, to close the Properties dialogue box and return to the main window, click on the X button in the top right hand corner of the box.
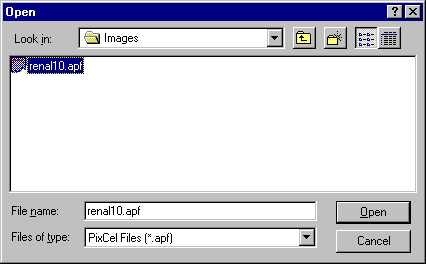
To load a file go to Main menu, click on File/Open. The Open dialogue box will appear.
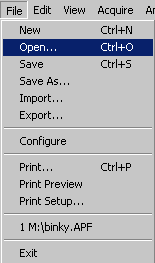
The Open dialogue box allows you to open a PixCel format file (*.APF or *.OPF) from a particular drive and folder.
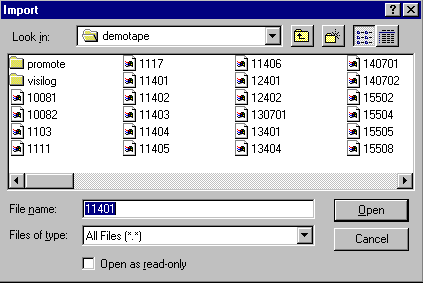
The Import option allows Imager2 and GCI images to be imported into PixCel™. The Import option allows Imager2 and GCI images to be imported into PixCel. Click on Import to open the Import dialogue box.
To save changes made to an image file go to Main menu and click on File/Save or press Ctrl+S. The image or sequence of images will be saved and will overwrite the previously saved sequence. To save a sequence in a different location or with a different name, click on File/Save As.
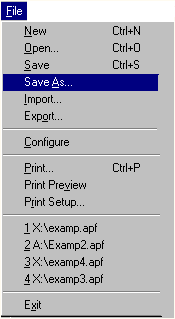
The Save As dialogue box will appear prompting you to enter a new drive, folder, file name and which images in the sequence to save.
Click on Save to save your image or the Cancel button to abandon the changes and revert to the main image window.
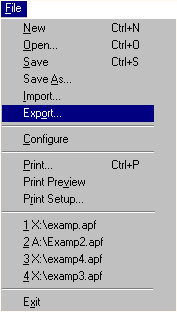
To save the current selected image as 8-bit DIB (Windows Bitmap), 8-bit TIFF or 16-bit TIFF, FITS, Imager2, Prisma, Spectacle or Grams format, go to the Main menu and click on File/Export to view the Export As dialogue box.
NOTE: These images may not be imported or opened by PixCel. If you want to view the image in the future with PixCel you must save a copy using the File/Save facility.
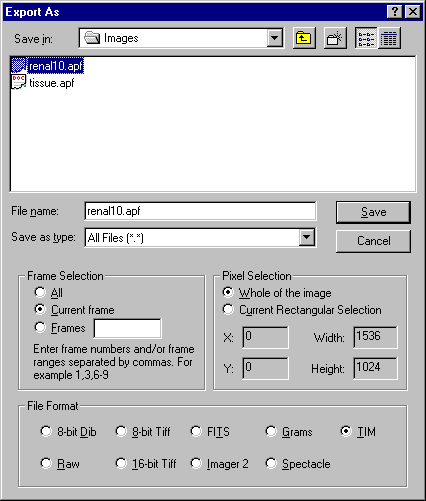
Select a folder to save into and enter a filename.
Choose the required frames from the Frames selection options. NOTE: the frame selection entry becomes red if an invalid range is selected.
Choose the print area using the Pixel selection i.e. whole of the image or a rectangle selection.
Check or uncheck either 8-bit DIB, 8-bit TIFF, 16-bit TIFF, FITS, Prisma, Spectacle or Grams options as appropriate.
Click on the Save button to save the image or Cancel to abandon the settings and return to the main window.
NOTE: Export can also be accessed by clicking the right hand mouse button in the Image window to bring up the Zoom in/out option box or by clicking on File in the main menu and selecting Export...
NOTE: When exporting an 8-bit image format, the exported image has the same grey level range as the displayed image.
NOTE: The TIM option is used to export image data in a form that can be read in by Life Science Resources’ Merlin software (a software package for High Speed Fluorescence Ratio Imaging). When a sequence is exported in this format, the images are stored one per file in a directory name based on a user name, experiment and a selected hard disk drive.
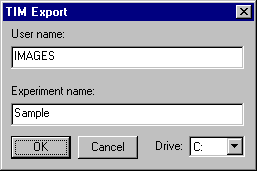
For example if the user is IMAGES and the experiment is SAMPLE, the files will be stored in the directory [DRIVE LETTER]:\IMAGES\SAMPLE. Each file will be named IMAGSAMP.X, where X is a hexadecimal number representing the image’s position in the sequence. A file IMAGSAM.TIM will also be written to the directory, which contains the timing information for each frame.
Select File/Save from the main menu, Ctrl+S, or use the Save icon on the software toolbar.
If saving for the first time, the Save As dialogue box will appear. Select or enter a file name and destination on disk and enter details together with the frame selection details.
Click the Save button. The image sequence will be saved to the selected location. Click on the cancel button to cancel the changes and revert to the main window.
If subsequently saving by clicking the save icon or selecting File/Save, the image saved previously will be overwritten.

Select File/Open from the main menu, Ctrl+O, or use the Open icon on the software toolbar. The Open dialogue box will appear. Select a file/image from the required location, then press the Open button to open the file/image or Cancel button to revert to the main window.
Select the Plot view from the View menu or use the ![]() icon on the view controls toolbar
icon on the view controls toolbar
The plot is made from the pixels that are under the line selection.
Use the First/Last/Next/Previous/Frame#/Play and Stop buttons on the view and navigation toolbar to move from one image to another in the sequence. The plot is updated with the pixels from the new image under the line selection.
Use the Copy option from the Edit menu or the Copy icon to copy the plot to the clipboard as a Windows Metafile and as Comma Separated Values (CSV text format). Alternatively, click the right hand mouse button to access a menu where the option of Copy to clipboard is also available.
Select Print from the file menu, the Print icon, or via the zoom in/out option box to print the plot. The plot can be previewed before printing by using the Print Preview menu option. The page can also be changed from landscape to portrait, letter to A4 etc, using the Page Setup option from the same menu.
Mapping controls are disabled in this view.
Select the Histogram view from the View menu or use the ![]() icon on the view controls toolbar
icon on the view controls toolbar
The histogram view is made from the pixels that are contained by the rectangle selection.
Use the First/Last/Next/Previous/Frame#/Play and Stop buttons on the view and navigation toolbar to move from one image to another in the sequence. The histogram view is updated with the pixels from the new image that are contained by the rectangle selection.
Use the Copy option from the Edit menu, or the Copy icon to copy the plot to the clipboard as a Windows Metafile or as Comma Separated Values (CSV text format). Alternatively, click the right hand mouse button to access a menu where the option of Copy to clipboard is also available.
Select Print from the file menu, the Print icon or via the zoom in/out option box to print the plot. The histogram can be pre-viewed before printing by using the Print Preview menu option. The page can also be changed from landscape to portrait, letter to A4 etc, using the Page Setup option from the same menu.
Statistics and Mapping controls are disabled in this view.
Select the Pixel Value view from the View menu or use the ![]() icon on the view controls toolbar
icon on the view controls toolbar
The pixel view is made from the pixels that are contained by the rectangle selection. It is shown in the form of a table.
Use the First/Last/Next/Previous/Frame #/Play and Stop buttons on the view and navigation toolbar to move from one image to another in the sequence. The pixel view is updated with the pixels from the new image that are contained by the rectangle selection. The minimum pixel value(s) are highlighted in blue and the maximum in red.
Use the Copy option from the Edit menu or the Copy icon to copy the pixel values to the clipboard as Comma Separated Values (CSV text format). Alternatively, click the right hand mouse button to access a menu where the option of Copy to clipboard is also available.
Select Print from the file menu, the Print icon or via the zoom in/out option box to print the plot. The pixel values can be previewed before printing by using the Print Preview menu option. The page can also be changed from landscape to portrait, letter to A4 etc, using the Page Setup option from the same menu.
NOTE: only the pixels in view are printed.
It is advisable to select the minimum area of specific interest and capture the rectangle before copying or printing as the amount of information in a full screen grab being copied to the clipboard will cause extended delay in copying or printing.
Statistics and Mapping controls are disabled in this view.
Select the User Value view from the View menu or use the ![]() icon on the view controls toolbar
icon on the view controls toolbar
Parameters used to capture a sequence are displayed using this feature. They include all the camera, sequence and focusing parameters i.e.
Exposure duration
CCD and Sink Temperatures
Pixel rate and sensitivity
CCD Properties: Size, Active area, Serial clocking, Parallel clocking, Clock & Bias voltage settings, Current temperature
CCD Readout: Exposure time, Regions, Binning factors, : Readout rate & Sensitivity
Head control: Heater setting, Grounding, Shutter type/ Shutter pulses
Sequencing details: Triggering, Pre-flushing, Readout, Looping
This information may not be edited by the user. It can, however, can be printed and faxed to the Hotline for diagnostic purposes should assistance be required.