| In early Aug 2002 we successfully commissioned the CIRPASS near-infrared spectrograph, built by the Instrumentation Group of the Institute of Astronomy on the 8-metre Gemini-South telescope. |
|---|
| This is an HST image of the radio galaxy 3C324 with the outline of our IFU superimposed as we observed it on Gemini-S. A scale of 0.36 arcsec per IFU lens was used and the total FOV of the IFU is 13.0x4.7 arcsec. |  |
|---|
 |
This is the processed (sky-subtracted and cosmic-ray rejected) image of the spectra of 3C324 as seen on the detector for a single 20min exposure. The dispersion direction is horizontal and the spatial direction is vertical. Each lens in the IFU produces a spectrum 2 pixels high. The vertical lines are noise fields from the subtraction of the strong OH lines in the Earth's atmosphere. At the centre and just below can be seen "loops" which are due to [OIII]5007 emission. These appear as loops because different parts of the galaxy on the IFU have different velocities. Using this data we will be able to make a map of the velocity structure of the galaxy. |
|---|
| CIRPASS takes ~500 images at different wavelengths with each image having about 500 pixels. The data can therefore be thought of as a "data-cube" with 2 spatial dimensions and one dimension of wavelength. This image is a slice through this data-cube along the axis of 3C324 for a total exposure time of 80 minutes. The spatial direction is vertical and the wavelength direction horizontal. The light from [OIII]4959 can be seen on the left and that from [OIII]5007 on the right. The change in wavelength across the galaxy clearly shows the change in velocity due to rotation. |  |
|---|
 |
The reconstructed image of the Einstein cross q2237+03. The four points around the centre are images of a background QSO lensed by a foreground galaxy. Each hexagonal spectral pixel (spixel?) is 0.36 arcsec across. This image was made using the H-beta emission line of the QSO. |
|---|
| This is the spectrum of one of the QSO sub-images. The broad line at ~13200A is H-beta. |  |
|---|
 |
The spectrum of the nucleus of the central lensing galaxy which does not show the H-beta line. |
|---|
| HST image of "Gomez's Hamburger" - a proto-planetary nebula. | 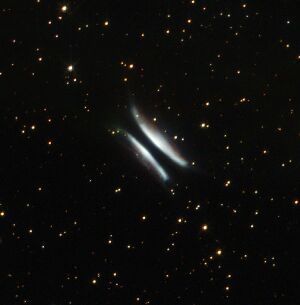 |
|---|
 |
Reconstructed IFU image of Gomez's Hamburger with the same orientation as the HST image showing total spectrum intensity. Three pointings of 10 minutes exposure time were taken with the object dithered along the long axis. The IFU appears therefore to have a FOV of 14.5x5.0 arcsec. Each hexagon in the image has a spectrum from 10689A - 13021A with a resolution of 4.5A. |
|---|
| Reconstructed IFU image of a two position beamswitch on Sco X-1. The two pointings (separated by 6 arcsec) were subtracted from each other to remove the sky giving a positive and a negative image. Each pointing was a 10 minute exposure in poor seeing and through cloud. |  |
|---|
 |
The extracted spectrum of Sco X-1 showing three prominent emission lines, HeI10830, Pa-gamma and Pa-beta. This spectrum has not been corrected for telluric absorption lines. The broad dip around 11300A is due to water in our atmosphere. |
|---|
| The 2D spectra for the ULIRG FS21219-1759. The target was sky-subtracted using an offset sky exposure. The exposure time was 15 minutes. |  |
|---|
 |
The extracted spectrum of the ULIRG. The redshift is ~0.111. The strong line at 12035A is HeI10830 and the line at 12158A is Pa-gamma. |
|---|
| A mosaic of 18 CIRPASS IFU pointings on the globular cluster M30. This image was taken on our first night of observing. North is up and east to the left. The total FOV is about 25x33 arcsec. The map shows total J-band flux. We have a spectrum for every one of the ~8000 pixels in the image. The centre of the cluster is near the top-centre of the image. |  |
|---|
 |
Image of the planetary nebula NGC 6369 in Pa-gamma. |
|---|
| Image of the planetary nebula NGC 6369 in Pa-beta. A mosaic of 22 pointings was used to take the wavelength range 1.0689-1.3021 microns simultaneously getting both Pa-beta and Pa-gamma. |  |
|---|
 |
Part of the Eagle Nebula, M16 (the "pillars of creation") imaged in the Paschen-beta emission line. Part of one of the pillars can be seen on the right and a dense foreground dust cloud can be seen to the lower left. |
|---|
| A visualisation of the data cube for a single exposure on the Eagle Nebula. Two emission lines can be clearly seen. |  |
|---|
 |
The Eagle Nebula: the top panel shows the 2D integral field `image' over a line-free spectral region; the lower three panels show the morphology in various Paschen emission lines |
|---|
| Uranus: A 15 second exposure showing the IFU image and the raw 2d spectra. The FOV of the IFU is 13x5 arcsec. | 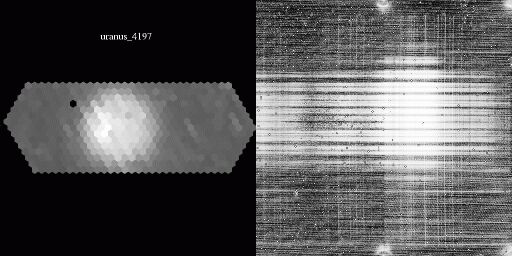 |
|---|
 |
Uranus exhibits limb darkening in the continuum and limb brightening in the Methane absorption lines. |
|---|
| We investigated the central dynamics of the Quintuplet
Cluster which is a massive young open cluster near the galactic centre.
This is a CIRPASS IFU image in the H-band. A 3 position
dither pattern was used. The seeing was ~0.5 arcsec. This is an
|
 |
|---|