

Keywords
Supernova cosmology, transient astronomy, dark matter, dark energy, strong lensing, microlensing, large-scale surveys
Current Research Projects
Time-Delay Cosmolography with Strongly Lensed Supernovae
In light of the Hubble tension, astronomy is looking to new probes, which are independent of the local distance ladder, with which to measure the Hubble parameter (H0). One promising example is time delay cosmography, which uses the offsets in time between the appearance of the multiple images of gravitationally lensed supernovae (glSN) to measure H0. Recently, the first measurement of the Hubble constant was made with the first glSN discovered, SN Refsdal (Kelly et al. 2023). The first measurement of H0 from a glSN Ia, SN H0pe, was recently accounced this year (Pascale et al. 2024; Pierel et al. 2024). With Rubin-LSST and Roman, we are excepted to find tens to hundreds of these systems. The study of strongly lensed transients is young, rapidly growing, and full of potential to uncover exciting new astrophysics and cosmology!
To best take advantage of the growing sample of glSNe, we need motivated statistical tools for estimating the time-delays of the multiple images of a glSN. I developed GausSN – a Bayesian Gaussian Process (GP) approach for time-delay estimation. GausSN models the underlying light curve non-parametrically using a GP. Without assuming a template light curve for each SN type, GausSN fits for the time delays of all images using data in any number of wavelength filters simultaneously. We also introduce a novel time-varying magnification model to capture the effects of microlensing alongside time-delay estimation. The performance of GausSN is demonstrated in Hayes et al. (2024). GausSN is scalable for time-delay cosmography analyses given current projections of glSNe discovery rates from Rubin-LSST and Roman. The source code is publicly available here.
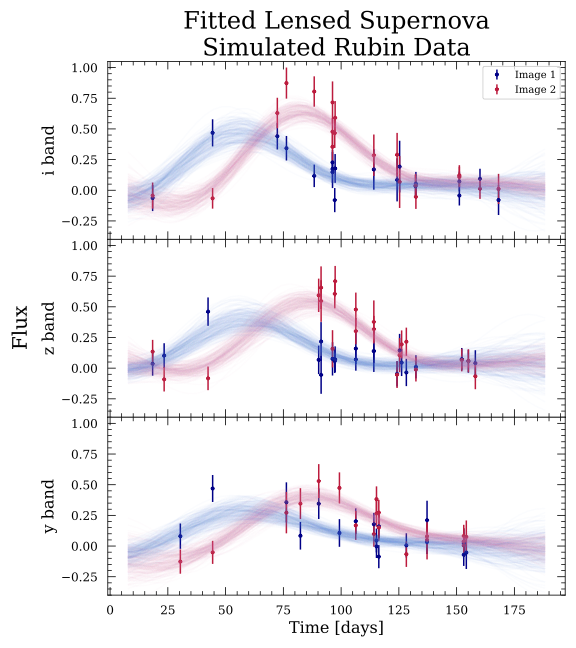
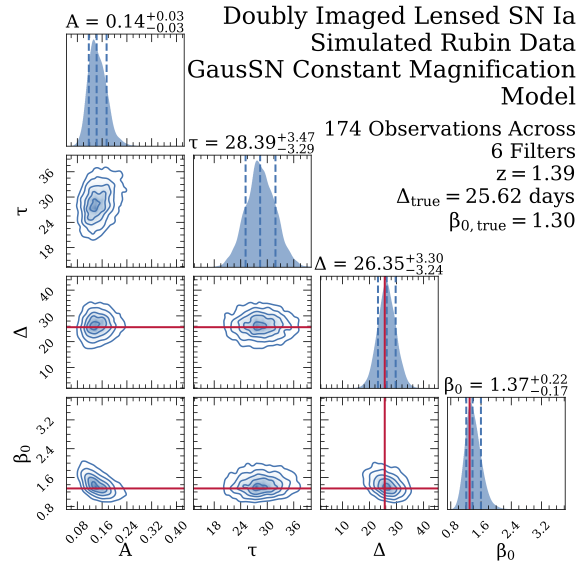
Above: (Left) A example simulated Rubin-LSST glSN Ia at z=1.39 fit by GausSN. The light curves fitting image 1 (blue lines) and those fitting image 2 (red lines) are time-shifted and magnified copies of the “true” underlying curve, which has been conditioned on the data from both images. (Right) The corner plot from the GausSN fit to the simulated Rubin-LSST glSN Ia shown to the left. From left to right, the parameters fit are the kernel amplitude, the kernel length scale, the time delay, and the magnification. The time delay and magnification are retrieved within 1 sigma of the truth.
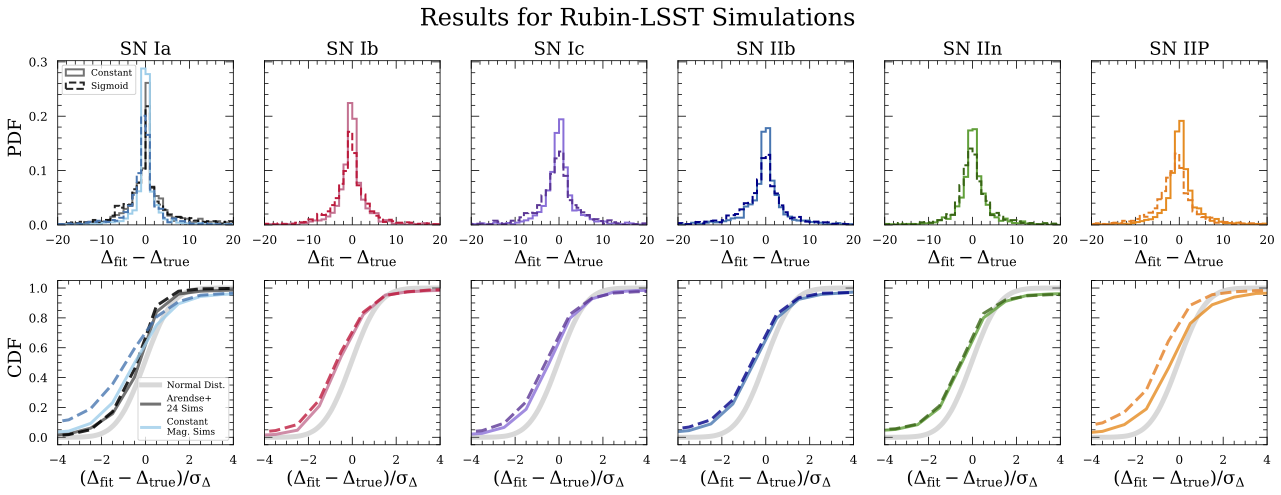
Above: The results from GausSN on simulated Rubin-LSST glSNe broken down by type of SN. The top row shows the distribution of fit time delay - true time delay. The solid line shows the results from fitting with the constant magnification model and the dashed line shows the results from fitting with the sigmoid magnification model. The bottom row shows the CDF of this distribution scaled by the uncertainty on the time-delay fit. If the uncertainties on the time delay estimates are well-calibrated, we expect the CDF to approximate that of a normal distribution, shown in the background as a thick, gray line.
Supernova Cosmology with BayeSN, a heirarchical Bayesian SED model
I am currently working on understanding the mass step in Type Ia Supernova (SNIa) observations by evaluating the impact of host galaxy properties – primarily dust – on the intrinsic and observed brightnesses of SNIa. To do so, I am working with data from CSP, CfA, YSE, Foundation, and more. There will be updates on this project to come in the near future!
Former Research
Classifying Transients and Variable Objects in Data from the Photometric LSST Astronomical Time-series Classification Challenge (PLAsTiCC)
With a number of upcoming large-scale surveys about to light up, such as Rubin LSST and Roman Space Telescope, the challenge in astronomy is quickly shifting to one of effective and efficient data analysis. For my Master's Thesis, I expanded the use of SCONE, a convolutional neural network (CNN) developed for supernova classification, to include non-SN transients and variable objects. SCONE works by stacking light curve data in 6 wavelength bands in time and wavelength to create a “heatmap,” which is fed into a CNN. This data processing format was chosen because CNNs are best equipped to classify images. Originally only suited for objects which peak in brightness once, I developed a second processing pipeline which was better suited for processing data which is continually changing in brightness over time. Example data and classification results for both the transient and variable star pipelines are shown below The data used was simulated by the PLAsTiCC team in anticipation of LSST.
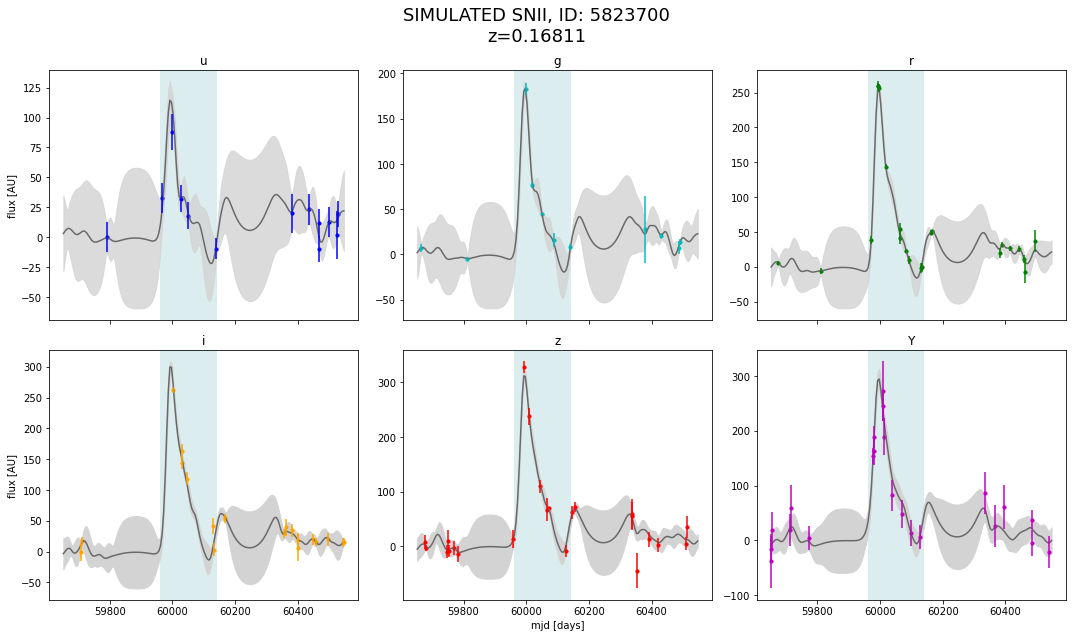
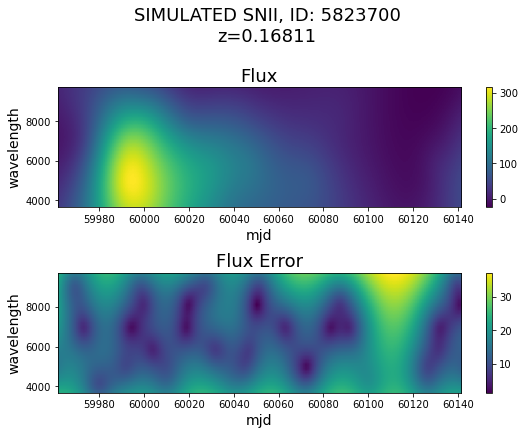
Above: (Left) A simulated SNII at redshift z = 0.16 with the underlying light curve modeled as a Gaussian Process. The light blue shaded region shows the time frame which will be represented in the heatmap, from 30 days before the peak i-band magnitude to 150 days after. For the variable star pipeline, the lightcurves are truncated to one “ observing season.” (Right) The heatmap created from simulated SNII data. On the x-axis is time in days and on the y-axis is wavelenth.
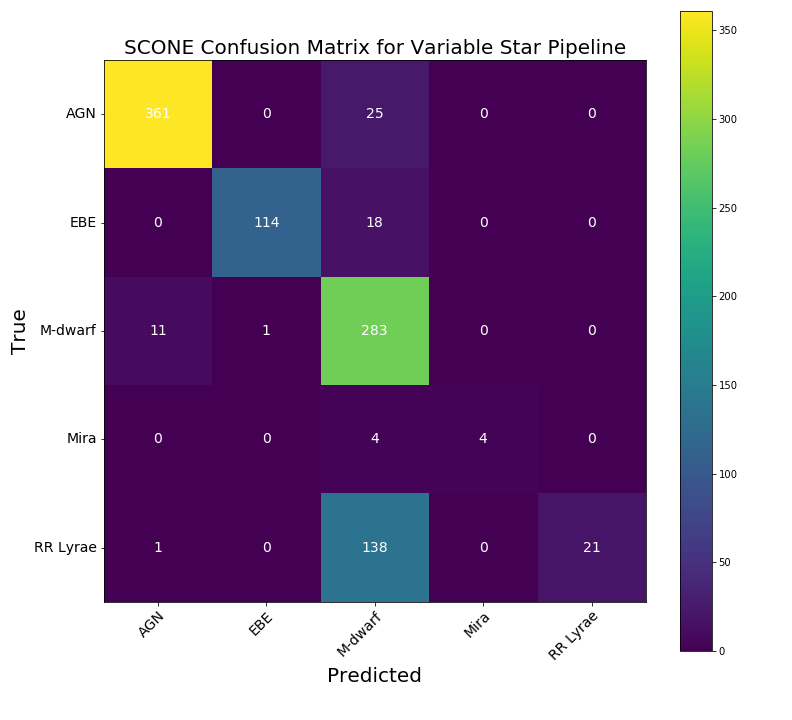
Above: (Left) The confusion matrix for SCONE’s transient pipeline after 300 epochs of training. Elements along the diagonal have been classified correctly, whereas elements off the diagonal have been “confused” with another class. The row represents the true label, while the column represents the predicted label. It is representitive of the ∼85% accuracy SCONE achieves on transient classification. (Right) The confusion matrix for SCONE’s variable star pipeline after 400 epochs of training. It is representitive of the ∼80% accuracy SCONE achieves on variable star classification.
Microlensing by Primordial Black Holes in the Dark Energy Survey (DES)
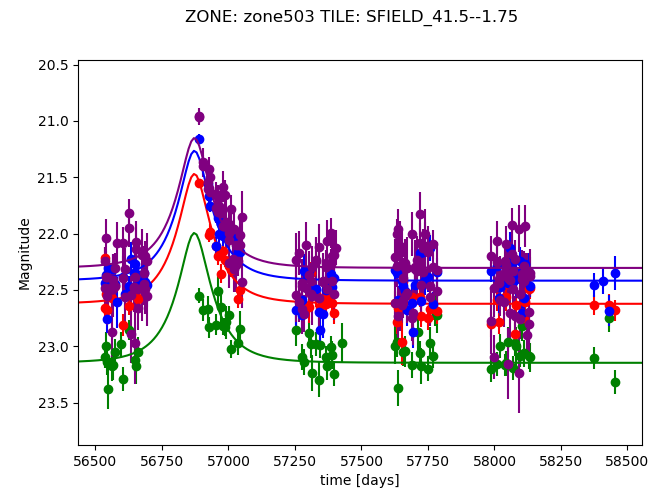
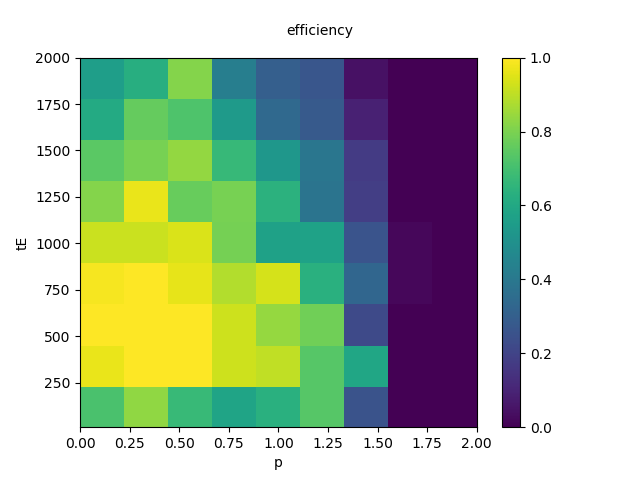
Since the 2016 discovery of the merger of two black holes by LIGO, intermediate mass black holes (BHs) have resurged as a potential dark matter candidate. Because LIGO can only detect black holes in binary systems, though, microlensing studies are incredibly important for understanding the number density of single black holes in the universe. In this project, I developed a statistical analysis pipeline to identify microlensing candidates in data from the four DES Supernova Zones. The pipeline fit light curves with a microlensing model, as given in Paczyński (1996), and then evaluated the quality of fit to output only likely microlensing candidates. DES ran for 6 years, enabling a study of long duration (high Einstein crossing time, tE) events, which are likely casued by black hole lenses of ~10-100 solar masses. Below on the left is an interesting candidate identified in DES data. The figure on the right shows the efficiency of identification in simulated data for objects with a given impact parameter, p, (x-axis), and tE (y-axis, in days).